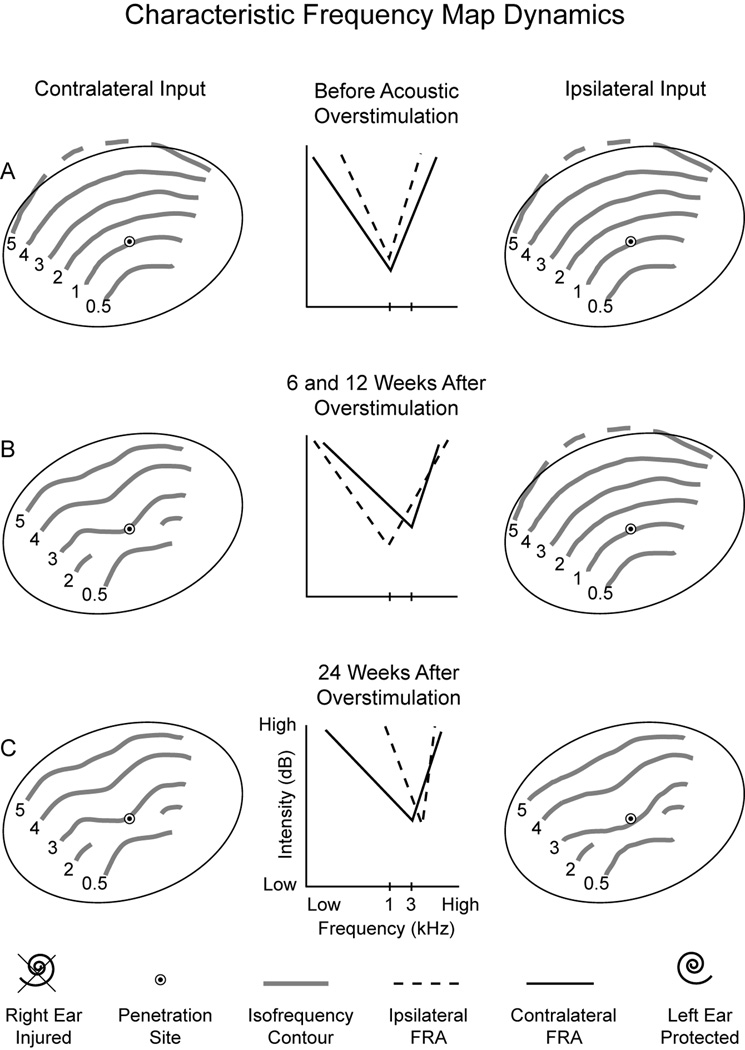
Figure 10.
Summary model description of frequency map dynamics in asymmetric mild sensorineural hearing loss. Left and right columns depict ipsilateral and contralateral isofrequency contour reorganization, and the middle column depicts frequency response area (FRA) dynamics for CF and threshold. A, The first row shows that contralateral and ipsilateral CF maps are in alignment in normal monkeys. B, At 6 and 12 weeks after acoustic overstimulation, contralateral CF and threshold shifts are to mostly higher values. Ipsilateral FRA parameters remain similar to those in normal monkeys. Misalignment of interaural CF and threshold maps is evident. C, At 24 weeks, ipsilateral CF and threshold shifts to higher values emerge. Realignment of interaural CF and threshold maps follows. Dashed line (5 kHz isofrequency contour) indicates entry into the suprameatal plane.

