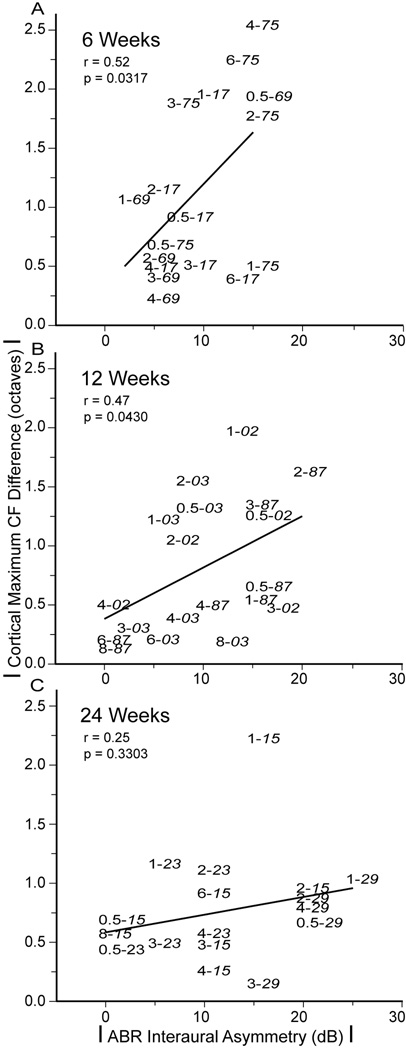
Figure 8.
Relationship between absolute ABR interaural threshold asymmetry and maximum CF difference levels for all recovery time periods (see text for detail). A & B, Monkeys at 6 and 12 weeks show moderately strong linear correlation (r = 0.52, 6 weeks; r = 0.47, 12 weeks; both p < 0.05). C, Monkeys at 24 weeks do not show a significant linear relationship (p > 0.05).

