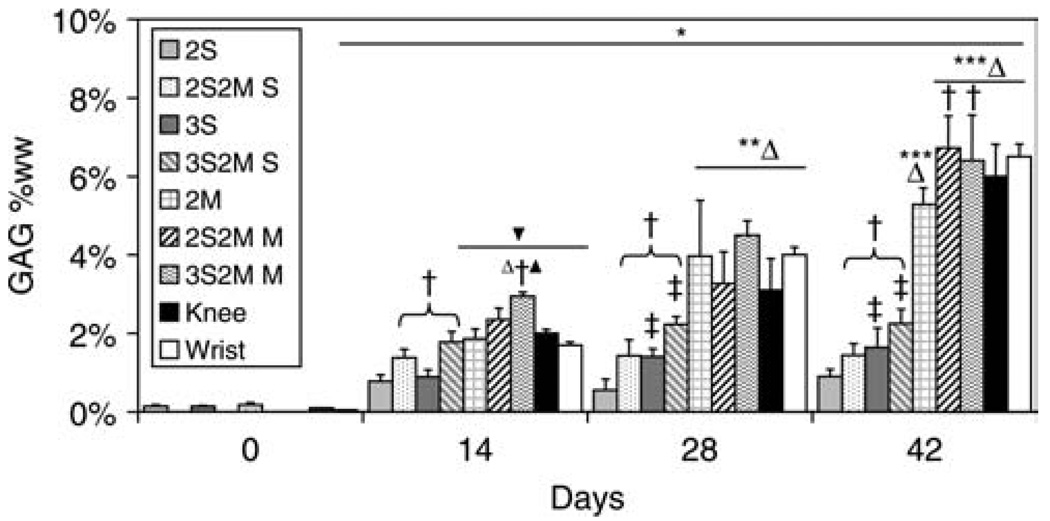
Figure 3.
GAG content of engineered cartilage constructs. For SZCs, increased agarose concentration (3S vs. 2S) and culture with MDZCs (3S2M S, 2S2M S) lead to increased GAG content. MDZCs cultured with SZCs (Knee, Wrist, 3S2M M, 2S2M M) also showed increased GAG content compared to MDZCs alone (2M). *p<0.05 vs. d0; **p<0.05 vs. d14; ***p<0.05 vs. d28; †p<0.05 vs. respective single layer group of same time point; ‡p<0.05 vs. respective 2% gel concentration group of same time point; Δp<0.05 vs. all superficial zone chondrocyte groups of same time point; ▲p<0.05 vs. Knee and Wrist of same time point; ▼p<0.05 vs. 2S and 3S of same time point.

