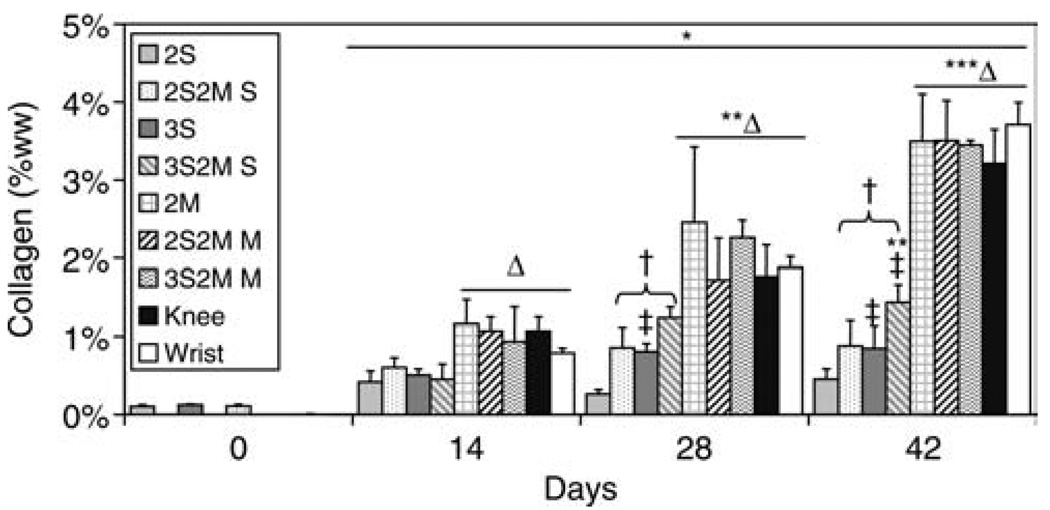
Figure 4.
Collagen content of engineered cartilage constructs. For SZCs, similar effects for concentration and contact with MDZCs were noted as with GAG content. No differences were noted for MDZCs cells. *p<0.05 vs. d0; **p<0.05 vs. d14; ***p<0.05 vs. d28; †p<0.05 vs. respective single layer group of same time point; ‡p<0.05 vs. respective 2% gel concentration group of same time point; Δp<0.05 vs. all superficial zone chondrocyte groups of same time point.

