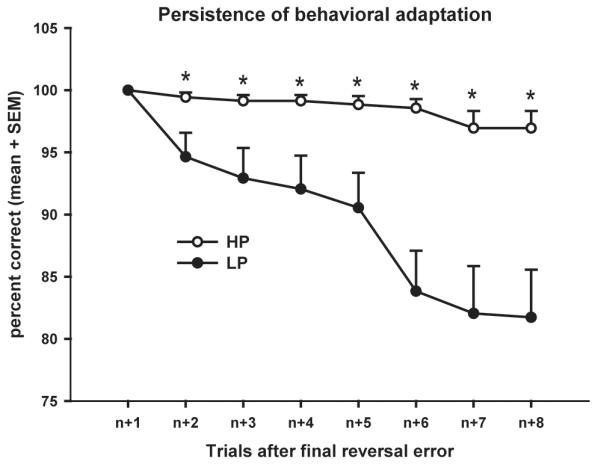
Fig. 2.

Persistence of behavioral adaptations for the two conditions. Shown on the x-axis is the number of trials after a successful reversal of behavior, i.e. trial n+1 is the trial immediately following the final reversal error. The values on the y-axis are the percentage of the 18 reversals, in which the subjects maintain this newly correct response on trials n + 1 to n + 8. * p<0.02.
