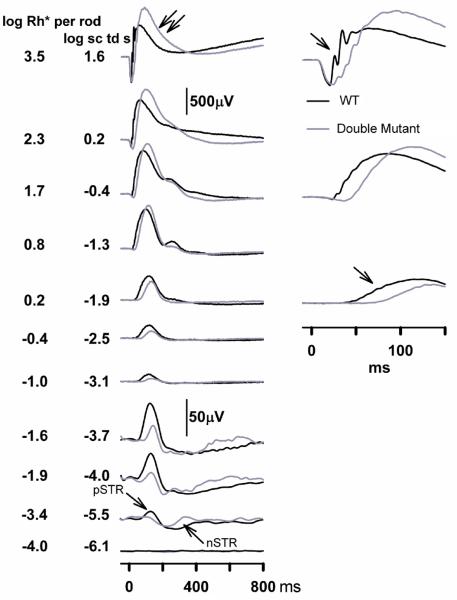
Figure 10. Effects of RGS7 + RGS11 gene disruptions on ERG flash responses.
ERG responses for representative subjects to brief flashes of increasing stimulus eneries, from bottom to top, for the fully dark-adapted condition. Grey traces, RGS7 and RGS11 double mutants; Black traces, WT littermate control. pSTR, positive scotopic threshold response; nSTR, negative scotopic threshold response. Unlabelled single arrows indicate a delay in the leading edge of the b-wave. Double arrows indicate a delay in the trailing edge of the b-wave.

