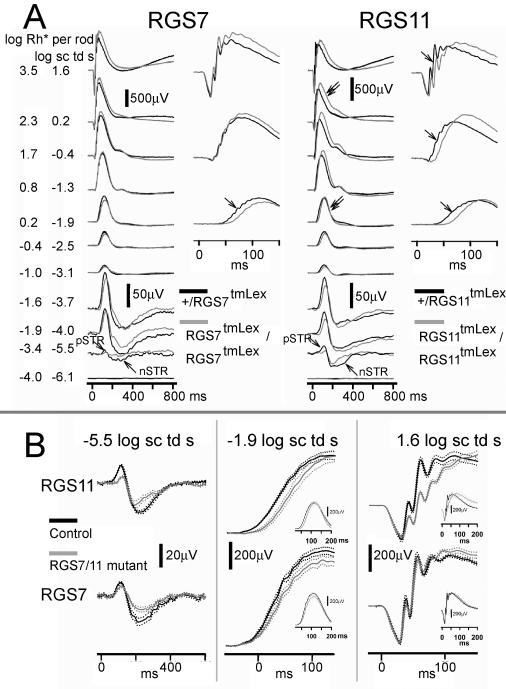
Figure 7. Effects of RGS7 and RGS11 gene disruptions on ERG flash responses.
A, ERG responses for representative subjects to brief flashes of increasing stimulus energies, from bottom to top, for the fully dark-adapted condition. Grey traces- left, RGS7 mutants; Grey traces- right, RGS11mutants; Black traces, heterozygous littermate controls. pSTR, positive scotopic threshold response; nSTR, negative scotopic threshold response. Unlabelled single arrows indicate a delay in the leading edge of the b-wave. Double arrows indicate a delay in the trailing edge of the b-wave that was found to be significant for the RGS11 mutants upon average (see Figure 9). B, Average ERG responses on expanded time scales. Solid traces show average responses for mutant mice (grey) and wildtype (black) littermates, with dotted traces showing ± one S.E.M. Top panel left, ERG responses for the RGS11 mutants for very low intensities (−5.5 log sc td s) show attenuation for both the positive and negative scotopic threshold responses (p-STR and n-STR). Middle, rod bipolar cell driven b-wave for scotopic intensities (−1.9 log sc td s) was delayed. Middle inset: the trailing edge of the b-wave response was unchanged. Right, the mixed rod + cone driven b-wave for higher stimulus intensities (1.6 log sc td s) showed a delayed leading edge but there was no significant change in the leading edge of the a-wave response. Right inset, Trailing edge of the b-wave was delayed in RGS11 mutant animals. Bottom panel, left, ERG responses for the RGS7 mutants for very low intensities (−5.5 log sc td s) show that the n-STR was attenuated. Middle, the rod bipolar cell driven b-wave for scotopic intensities (−1.9 log sc td s) was delayed and slightly decreased in amplitude. Middle inset, the trailing edge of the b-wave response was unchanged. Right, there was no significant change in the b-wave for the mixed rod + cone ERGs for higher stimulus intensities (1.9 log sc td s) or the leading edge of the a-wave. Right inset, trailing edge of the b-wave was not significantly delayed in RGS11 mutant animals. (n= 4 for RGS7 mutants and their littermate controls; n =9 for RGS11and n = 6 for RGS11 littermate controls).

