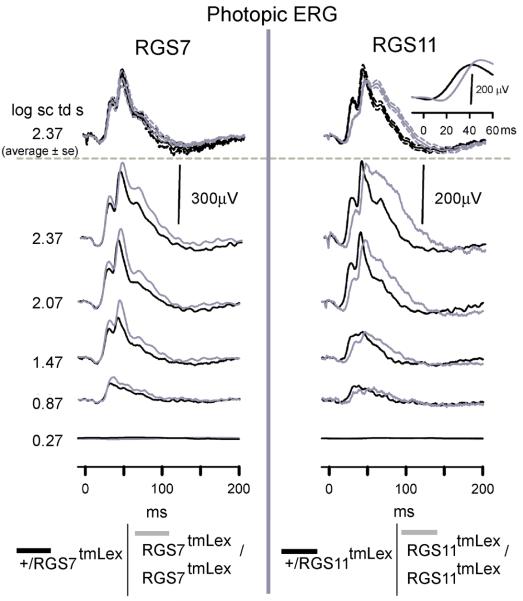
Figure 9. RGS11 but not RGS7 mutation delays the b-wave of the photopic ERG.
ERG responses for representative subjects to a range of increasing stimulus energies, from bottom to top, recorded for a rod suppressing background of 1.8 log sc td. The top most traces represent averaged ERG response for a high energy flash of 2.3 log sc td s (n= 4 for RGS7 mutants and their littermate controls; n =9 for RGS11and n = 6 for RGS11 littermate controls). Grey traces- left, RGS7 mutants; Grey traces- right, RGS11mutants; Black traces, heterozygous littermate control; dotted traces, ± S.E.M. Inset top right corner, shows the averaged b-wave traces after filtering OP's.

