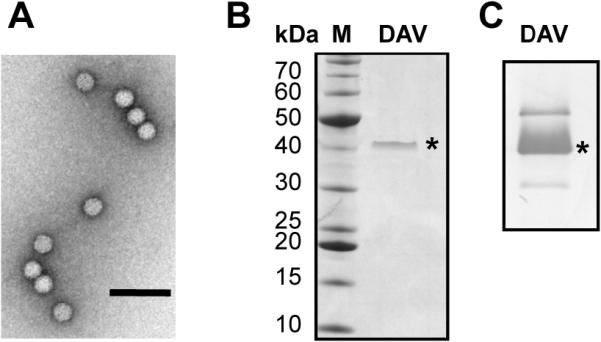
Figure 1. Analysis of DAV virions and structural proteins.

A. Gradient purified virions were negatively stained and visualised using transmission electron microscopy at 100,000 times magnification. Black bar represents 100 nm. B. The proteins present in purified virus particles were separated by electrophoresis through a 4-12% Bis-Tris gradient gel. Total protein was visualised by staining with Coomassie Blue. The capsid protein is indicated by the asterisk. The sizes of the molecular mass markers are shown on the left. C. Virion proteins separated on a SDS-10% polyacrylamide gel were transferred to a nitrocellulose membrane and detected with a rabbit polyclonal anti-DAV antibody. The band marked with an asterisk corresponds to the 42 kDa protein indicated in part B.
