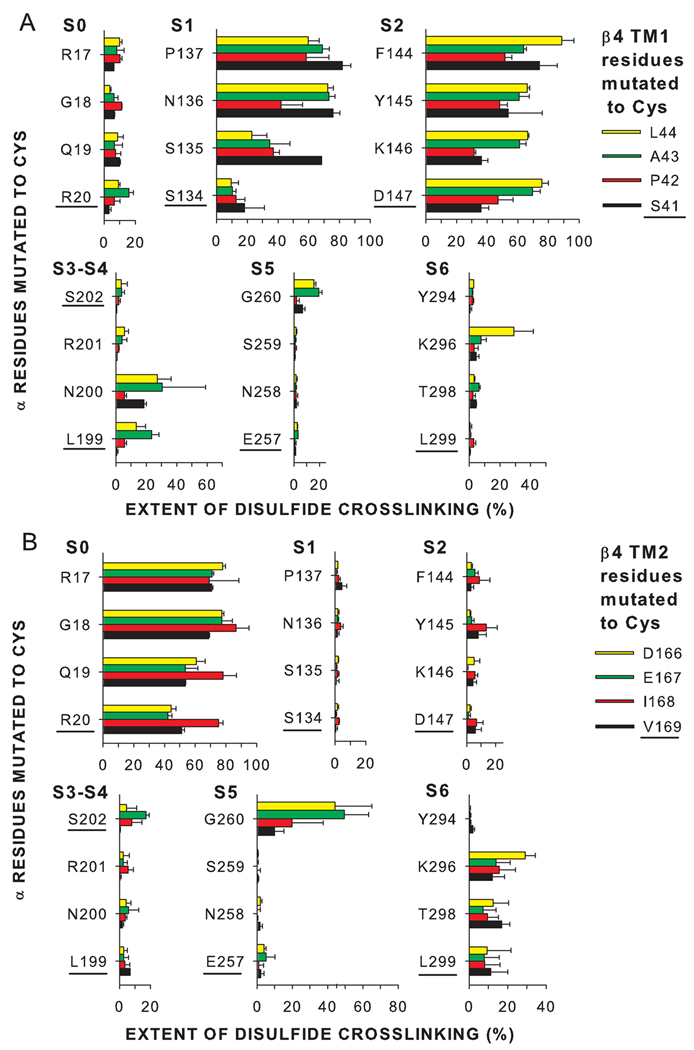
Figure 3. Extents of endogenous disulfide-bond formation between Cys substituted in the extracellular flanks of α and β4.
(A) α S0-S6 flanks and β4 TM1 flank. (B) α S0-S6 flanks and β4 TM2 flank. The α residues substituted by Cys are indicated along the left edge of each vertical axis, and the β4 residues substituted by Cys are color-coded as shown. The extent of disulfide-bond formation is represented by bars in the horizontal direction. In the cases in which the mean extent of disulfide bond formation was zero, the value 0.5% was plotted to identify these pairs as tested. The residues closest to the membrane are underlined and are plotted closest to the bottom of the figure.

