
Figure 1.
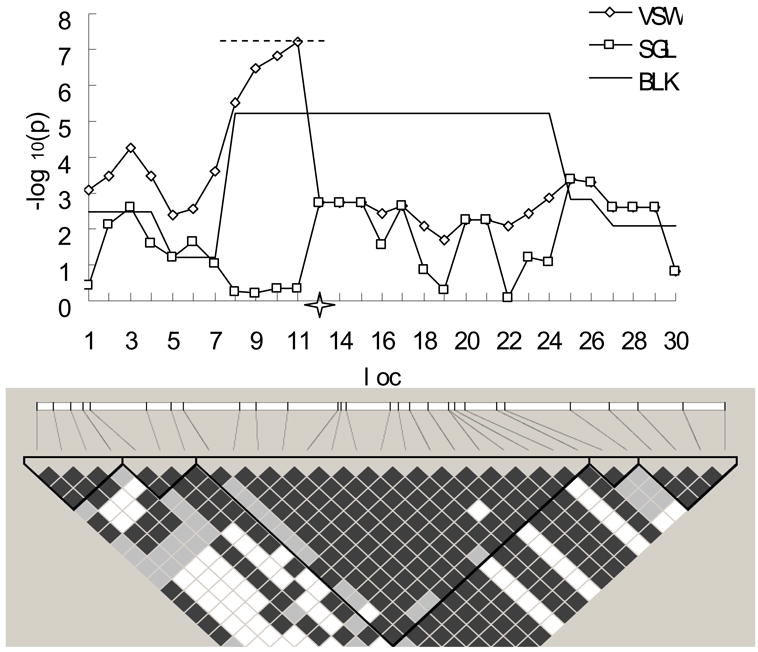
The –log10 of raw p-values obtained via the three proposed strategies in an example randomly selected from the power simulation studies and its LD structure. VSW, BLK and SGL denote association mapping strategy using variable-sized sliding windows, haplotype blocks, and single SNP loci, respectively. Four hundred cases and an equal number of controls were simulated, with medium recombination rate (10-8 per site per generation). The X-axis shows the simulated loci and the 4-point star in the middle of X-axis indicates the location of the putative locus with relative risk of 2. The dashed line on top, covering SNP 7 to SNP 13, indicates the best window with which the smallest p-value for VSW was achieved. LD block structure is shown in the bottom frame. The color from white to black represents the increasing strength of LD.