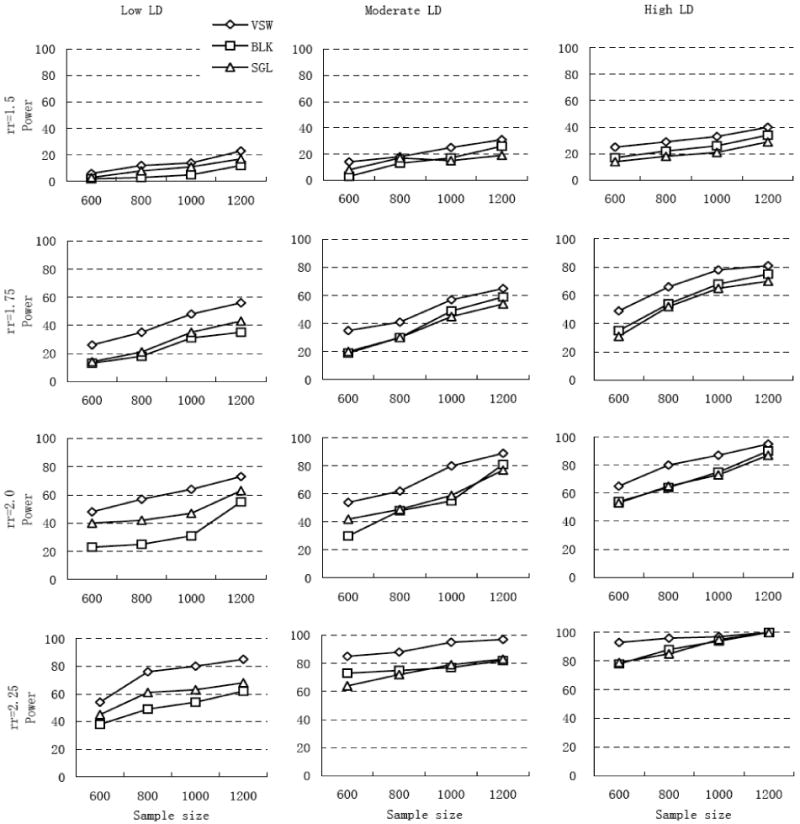
Figure 2.

Detection power for the three proposed mapping strategies. Disease relative risk (rr) was set to 1.5, 1.75, 2.0, and 2.25 (four rows). Extent of LD was categorized as low, moderate, and high LD (three columns), with recombination rate (r) per site per generation in the simulation region set to 10-7, 10-8 and 10-9, separately. Disease prevalence was 5%. VSW, BLK and SGL denote association mapping strategy using variable-sized sliding windows, haplotype blocks, and single SNP loci, respectively.
