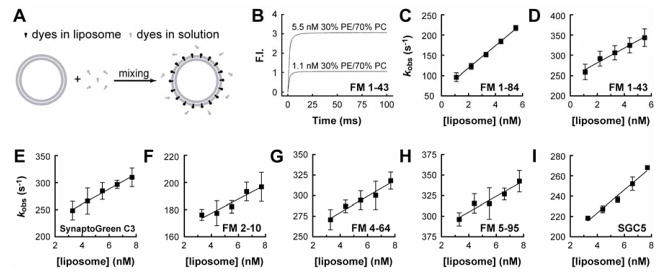
FIGURE 5. Binding and unbinding kinetics of dye•membrane interactions.
(A) Outline of the experimental procedure used to measure the association of dyes with membranes. Dye and liposomes (30% PE/70% PC) were rapidly mixed in a stopped-flow spectrometer at a 1:1 volume ratio; binding results in a marked increase in fluorescence intensity. (B) Representative traces of the fluorescence increases that occur upon mixing dyes with two concentrations of liposomes. The traces can be well fitted using single exponential functions and the rate, kobs, determined. (C–I) The observed rates, kobs, were plotted as a function of [liposome]. The rate constants, kon and koff, were obtained from these plots by assuming pseudo first order kinetics as detailed in Materials and Methods. The dissociation constants, Kd, were determined from koff/kon (Table 1). Error bars represent mean ± SE from three independent determinations.

