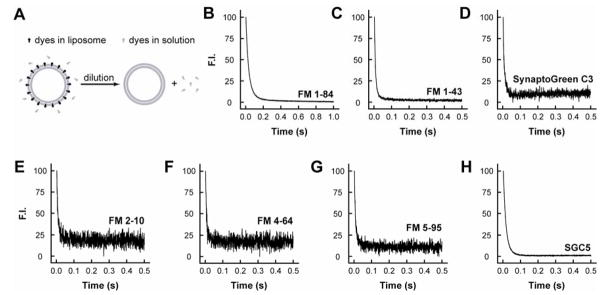
FIGURE 6. Departitioning kinetics of dye•membrane complexes.
(A) Outline of the experimental procedure used to measure departitioning kinetics. Dye/liposome mixtures were rapidly diluted (1:11); as membrane-bound dyes dissociate, the fluorescence intensity decreases. (B–H) Representative traces, and exponential fits, showing the rate of dye dissociation from membranes.

