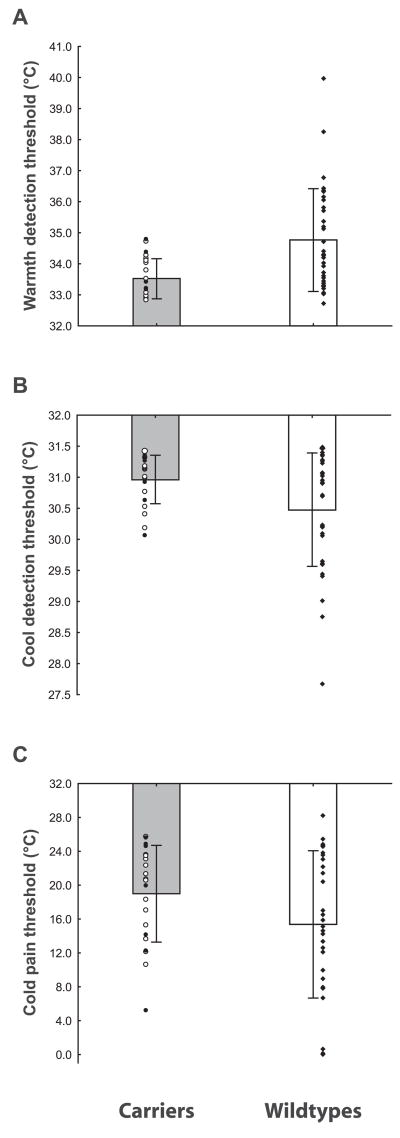
Figure 1.
Group differences. A, Warmth detection thresholds were significantly lower in the carriers than in the controls (p < 0.001); Ncarriers=22 (11 females), Nwild types=34 (17 females). B, Carriers displayed lower cool detection threshold than the wild types (p < 0.03); Nwild types =21 (10 female), Ncarriers =34 (16 females). C, Carriers tended to display lower cold detection thresholds than the wild types (p =0.095); Ncarriers =22 (11 females), Nwild types =35 (17 females). Raw data are displayed for each group. Circles, Carriers (white: c.918 –919insA; black: c.934C→T); diamonds, wild types. Bars represent mean ±SD.

