
Fig. 5.
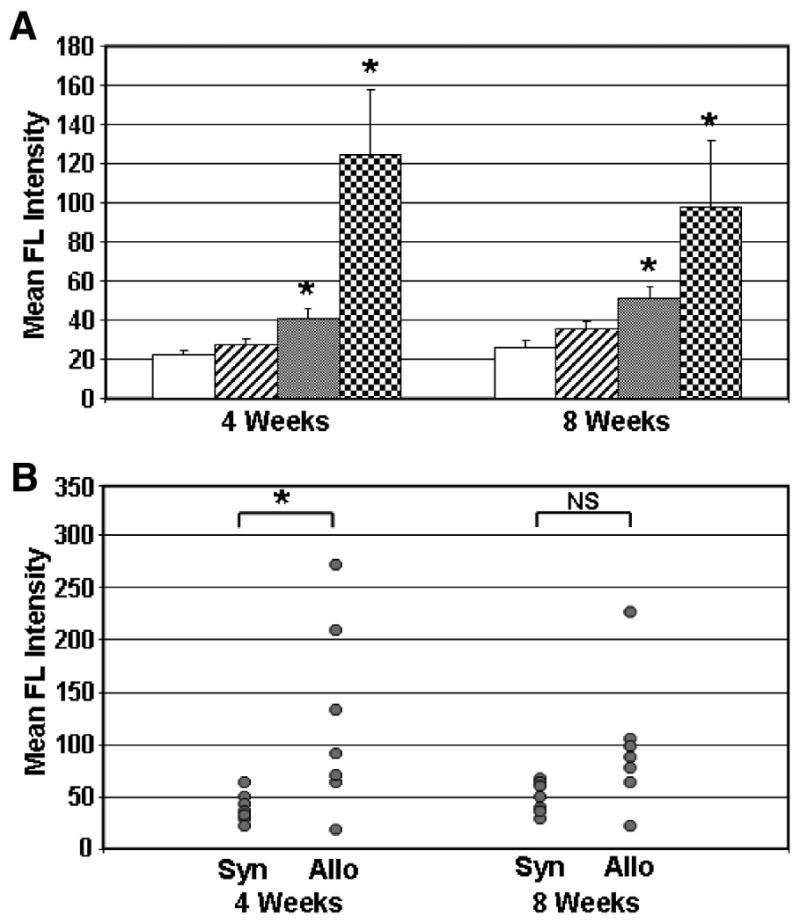
Serum antibody binding to ACI strain rat ASCs. Mean group serum antibody responses of recipient Fischer rats at 4 and 8 weeks postimplantation are shown in (A). Groups are described in Figure 2. The mean group MFI response ± standard error of the mean is shown. Significant differences from the No Trt background response are denoted with an asterisk (p < 0.05). Individual rat serum antibody responses to ACI strain rat ASCs are shown in (B). Antibody responses from individual rats are shown for the Syn+Scaf and Allo+Scaf groups at 4 and 8 weeks postimplantation. The significance of differences between groups is shown by brackets. NS, not significant.