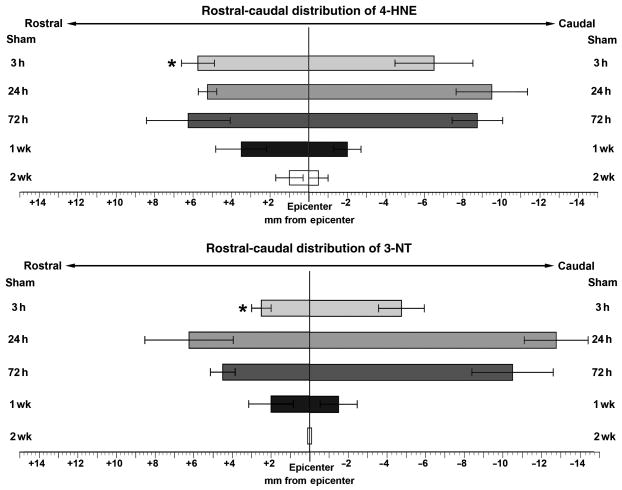
FIG. 4.
Graphic summary of the rostral-caudal distribution of staining for both 4-HNE and 3-NT over various time-points in the injured rat spinal cord (values =mean ±SEM for 4 animals/time-point). The extent of staining for 4-HNE and 3-NT are expressed in millimeters from the epicenter (0) in both the rostral (+) and caudal (−) directions. See methods section for details on measurements. The top panel shows the extent of 4-HNE staining, with the peak of its distribution between 24 and 72 h post-injury and some staining found up to 1 mm from the epicenter as late as 2 weeks post-injury. The bottom panel shows the extent of 3-NT staining, with the peak again occurring between 24 and 72 h post-injury. At 1 week post-injury, some staining was present up to 2 mm from the epicenter, but by 2 weeks post-injury, staining was found only in the epicenter sections (*p < 0.05 versus 4-HNE at the same time-point by paired t-test).

