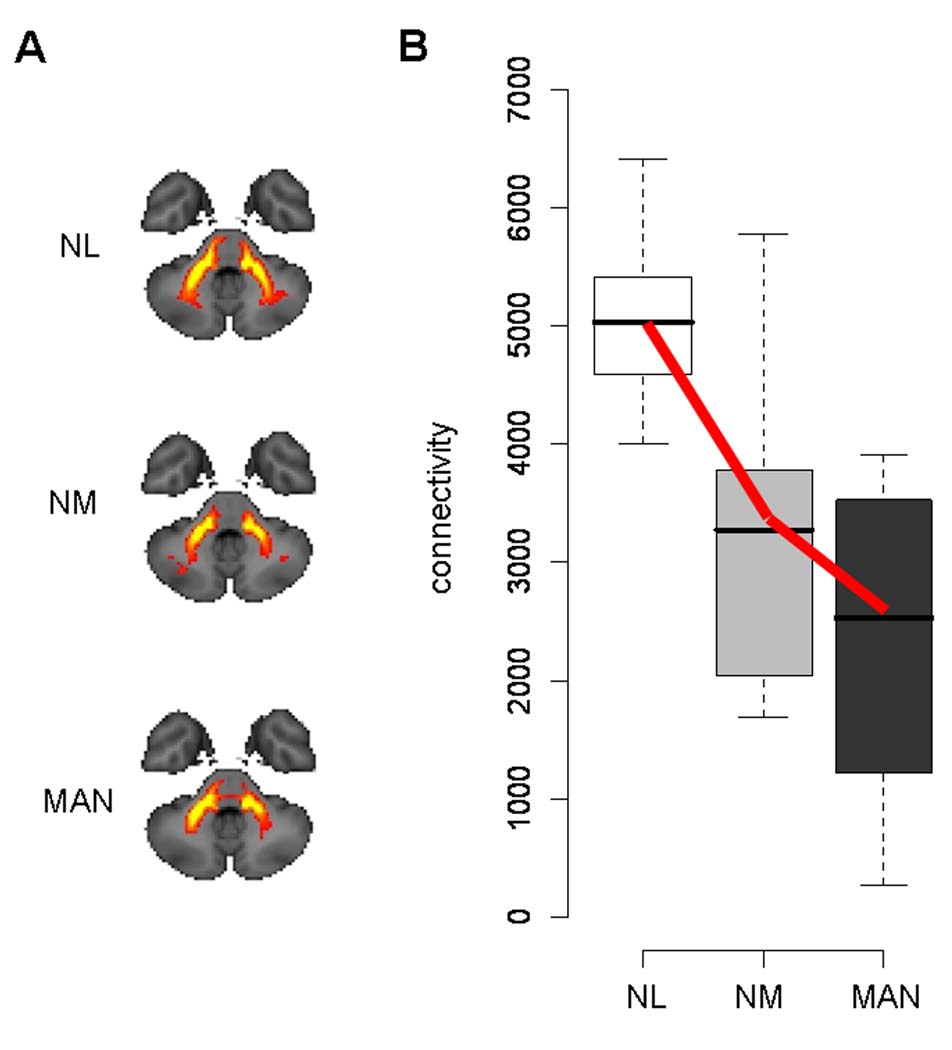
Figure 2. Reduced cerebellar outflow in dystonia gene carriers.
A. Two dimensional (2D) projections of the group mean probabilistic connectivity tracts (PCTs; see Materials and Methods) generated from seed masks a and b (Figure 1) in normal control subjects (NL, n = 8), and in non-manifesting (NM, n = 8) and manifesting (MAN, n = 12) dystonia mutation carriers. Reduced fiber tract integrity is evident in the proximal portion of the cerebellar outflow pathway in the NM and MAN groups.
B. Box-and-whisker plot showing connectivity values for cluster a1 (Figure 1) in the proximal portion of the CbTC pathway. Connectivity in this region, corresponding to dentato-thalamic projections, was abnormally reduced in both MAN and NM gene carriers (p < 0.001 and p < 0.01, Mann-Whitney U tests). A significant decreasing trend (NL > NM > MAN, bold lines) was detected across the three groups (p < 0.001, J–T test of trends).

