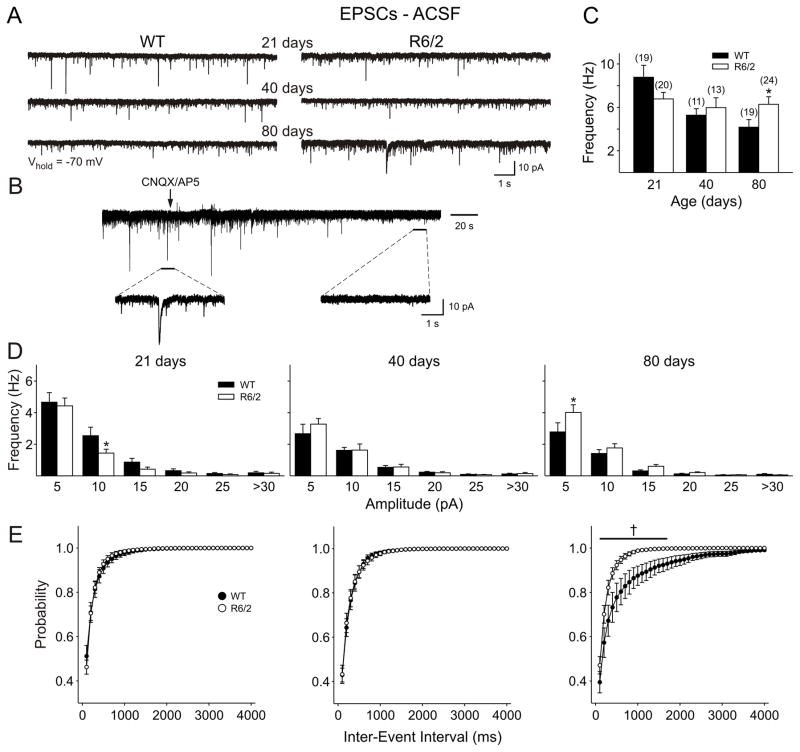
Figure 1.
A: Typical voltage clamp traces are shown for both WT and R6/2 cells from mice in each age group. B: CNQX/AP5 application completely blocked all synaptic currents at a membrane holding potential of −70 mV. Insets show traces on a magnified time scale to more clearly show the effect of blocking ionotropic glutamate receptors. C: Mean frequencies (±S.E.M.) of EPSCs recorded in ACSF for each age group. Note the significant decrease in frequency with age in cells from WTs that does not occur in cells from R6/2 mice. D: Amplitude-frequency histograms for EPSCs recorded in ACSF for each age group. E: Cumulative probability curves for inter-event interval showing a significant increase in release probability at 80 days. In this and subsequent figures, sample sizes are in parentheses and significant differences are denoted by * p<0.05; ** p<0.01; *** p<0.001; † p<0.05-p<0.001.

