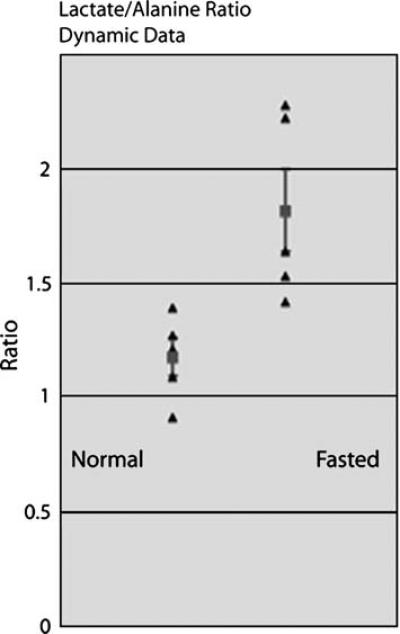
Fig. 4.
The data points and mean values for peak lactate to alanine ratios are shown from normal and fasted rat MRS slice acquisitions. Normal rat liver showed a significantly lower lactate to alanine ratio (P<0.01) than fasted rat liver. Mean/SD—(normal 1.18±0.18, fasted 1.82±0.40). Note: triangular markers show the collected data points and the square marker/error bars show the mean/standard errors.

