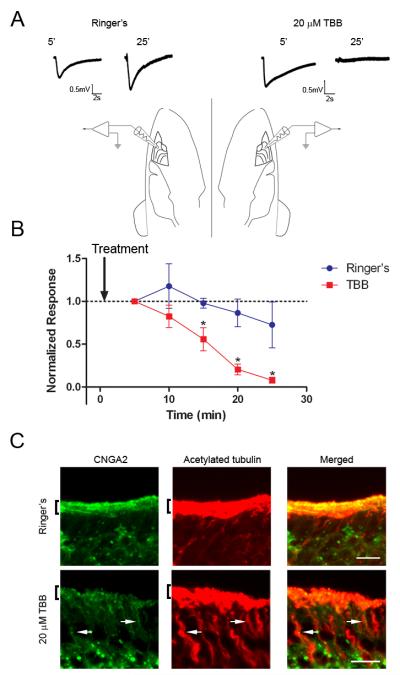
Figure 6. Inhibition of CK2 Alters the Ciliary Localization of Olfactory Signaling Proteins. CK2 Inhibition Impairs Olfactory Function.
(A) Representative traces from paired EOG recordings from turbinate II or IIb in response to amyl acetate. Mice were prepared as indicated in Materials and Methods and two electrodes were placed on the surface of the OE on opposite sides of the head. OE was treated with Ringer’s solution control (left) or Ringer’s plus 20 μM TBB (right) for 5 minutes and then EOG responses were recorded every 5 minutes. Representative traces are shown at 5 and 25 minutes for both treatments. Scale bars represent 0.5 mV and 2 seconds. (B) Average data demonstrate a rapid loss of EOG response from the TBB-treated OE (n=5) (* p < 0.05; paired t-test). Responses were normalized to the first trace taken at 5 minutes after treatment. Arrow indicates time of drug delivery. (C) Representative images taken from the medial surface of the olfactory turbinates exposed to either Ringer’s control (top) or 20 μM TBB (bottom) for 25 minutes. Sections were coimmunostained with antibodies against CNGA2 (left, green) and acetylated α tubulin (middle, red). Merged images shown on right. Bars represent 10 μm. Arrows mark dendritic tracks with concentrated CNGA2 signal. Brackets denote cilia layer.

