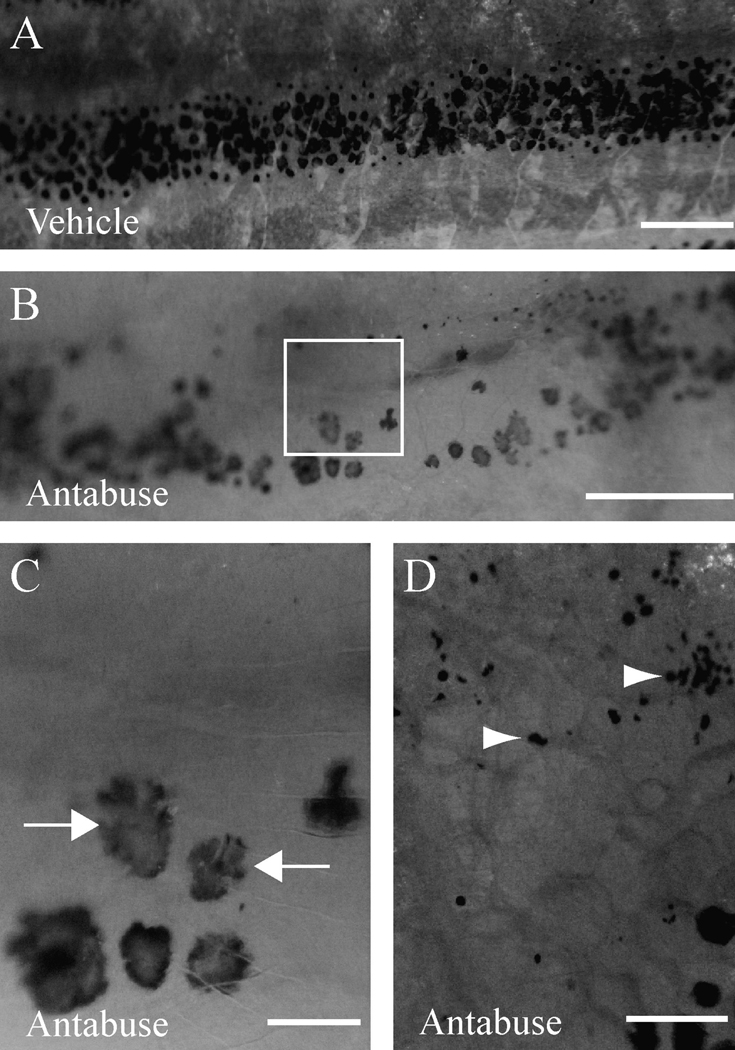
FIG. 5.

Partial loss of melanocytes after antabuse treatment. (A) Vehicle treatment. (B) 10 µM antabuse. Note the large gap in the stripe that is typically not observed in untreated fish. (C) A close-up of the box in (B) showing lobular melanocytes (arrows) (D). A close-up of a similar gap to (B), except with melanocyte detritus (arrowheads). Scale bars in (A, B) are 500 µm and in (C, D) are 100 µm.
