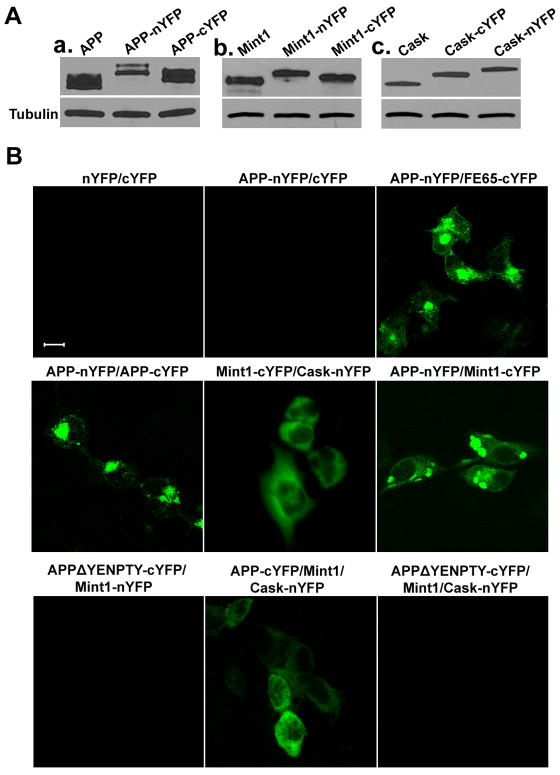
Figure 8.
Visualization of APP associated protein complexes by BiFC analysis. A. Western blotting of HEK293 cells transfected with DNA constructs encoding APP, Mint1 or Cask proteins fused to complementary fluorescent protein fragments (nYFP or cYFP). Total protein lysates were blotted with the APPc antibody (a.), anti-Mint1 (b.) and anti-Cask (c.) antibodies. B. HEK293 cells were co-transfected with the BiFC constructs indicated above the images. BiFC complexes were imaged 24 h after transfection. Scale bars: 10 μM.

