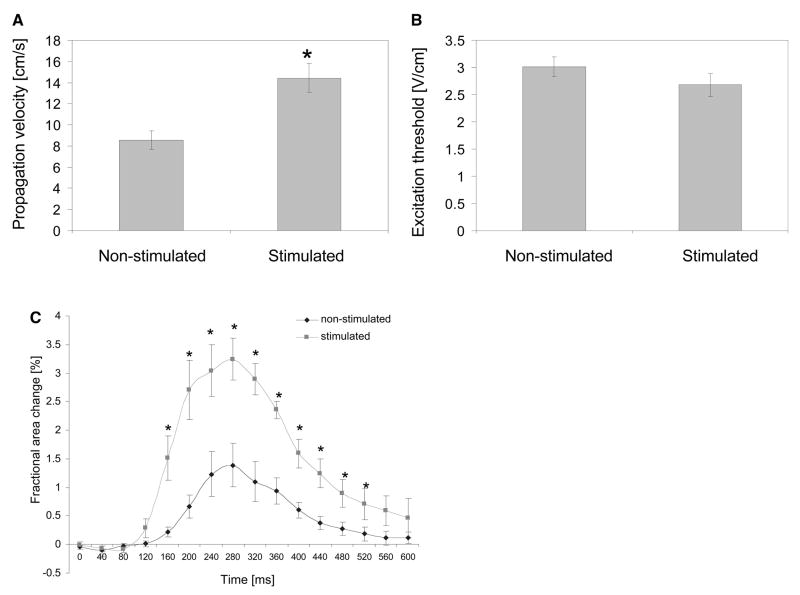
FIG. 3.
Excitability and contractile properties of engineered cardiac tissues. (A) Conduction velocity as determined by optical mapping. (B) Excitation threshold in response to electrical field stimulation. (C) Construct area change during paced contractions for engineered cardiac tissue cultivated with electrical field stimulation and nonstimulated controls. *Significantly higher than nonstimulated control. In (A) and (B) data are represented as average ± SE for n = 9 samples in the stimulated group and n = 7 samples in the nonstimulated group. In (C) data are represented as average ±SE with n = 4 samples in the stimulated group and n = 6 samples in the nonstimulated group.

