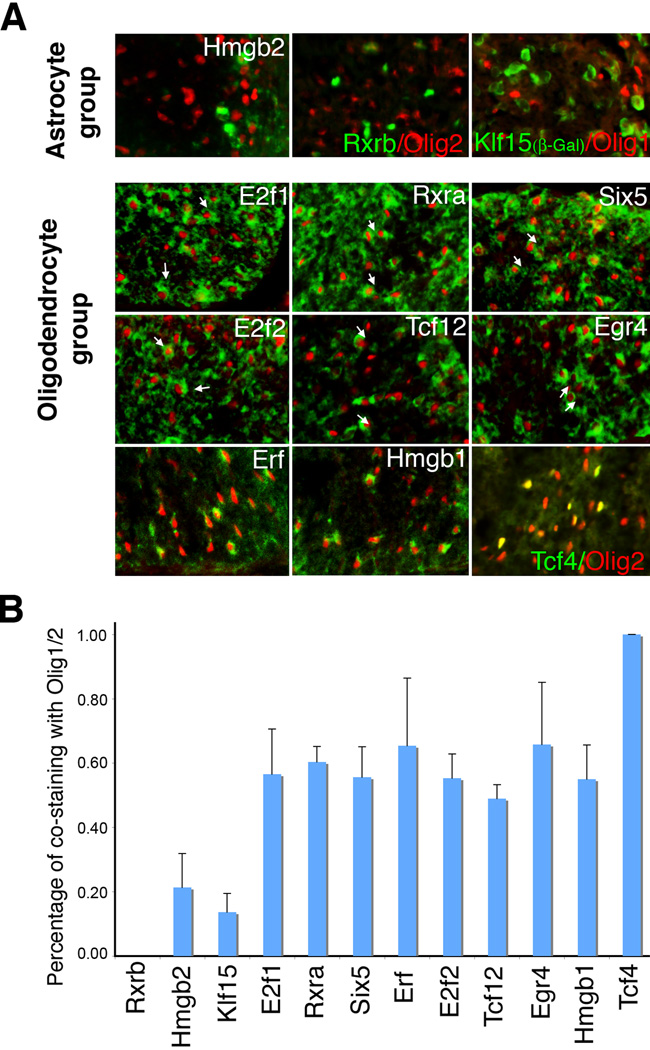
Figure 2. Segregation of glia-related transcription factors into an astrocyte group and oligodendrocyte group.
A) Expression assays in P0 spinal cords. Oligodendrocytes are imaged by immunofluorescence with antibodies to Olig2 or (in the case of Klf15) Olig1. Transcription factors from the Mahoney database are imaged by in situ hybridization (green pseudocolor) except for Klf15 (imaged by β-galactosidase) and Rxrb (imaged by immunofluorescence). In the astrocyte group of transcription factors, there is minimal overlap with Olig2 or Olig1. In the oligodendrocyte group, cells double labeled with Olig2 antibodies (arrows) are far more common. B) Quantification of double-stained cells, presented as percent overlap with Olig1/2. Klf15 was double-stained with Olig1. All other transcription factors were double-stained with Olig2. Error bars indicate standard deviation (n: Rxrb=3, Hmgb2=14, Klf15=7, E2f1=7, Rxra=5, Six5=6, Erf=9, E2f2=6, Tcf12=3, Egr4=5, Hmgb1=12, Tcf4=9).

