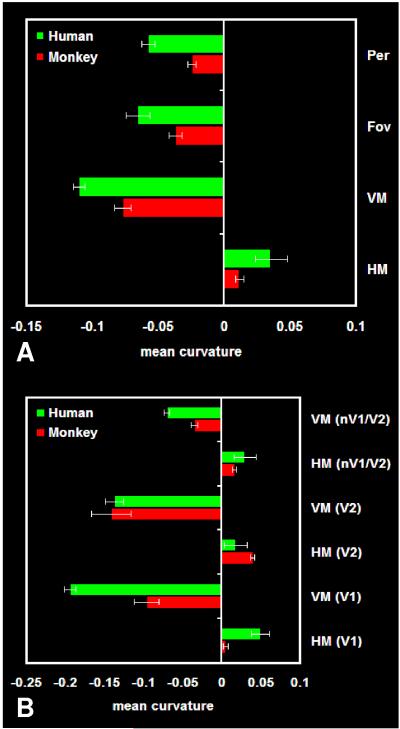
Figure 3. Gyral-sulcal bias for different retinotopic conditions.
(A) The bar plot shows the mean curvature value (see text for formula) for HM, VM, Fov, and Per vertices in the entire visual cortex, averaged across all monkey and all human data. (B) The bar plot shows the mean curvature value for HM and VM vertices in V1, V2, and ‘non-V1/V2’ (nV1/V2) visual cortex, averaged across all monkey and all human data. The error bars indicate one standard error of the mean, as obtained by averaging across hemispheres.

