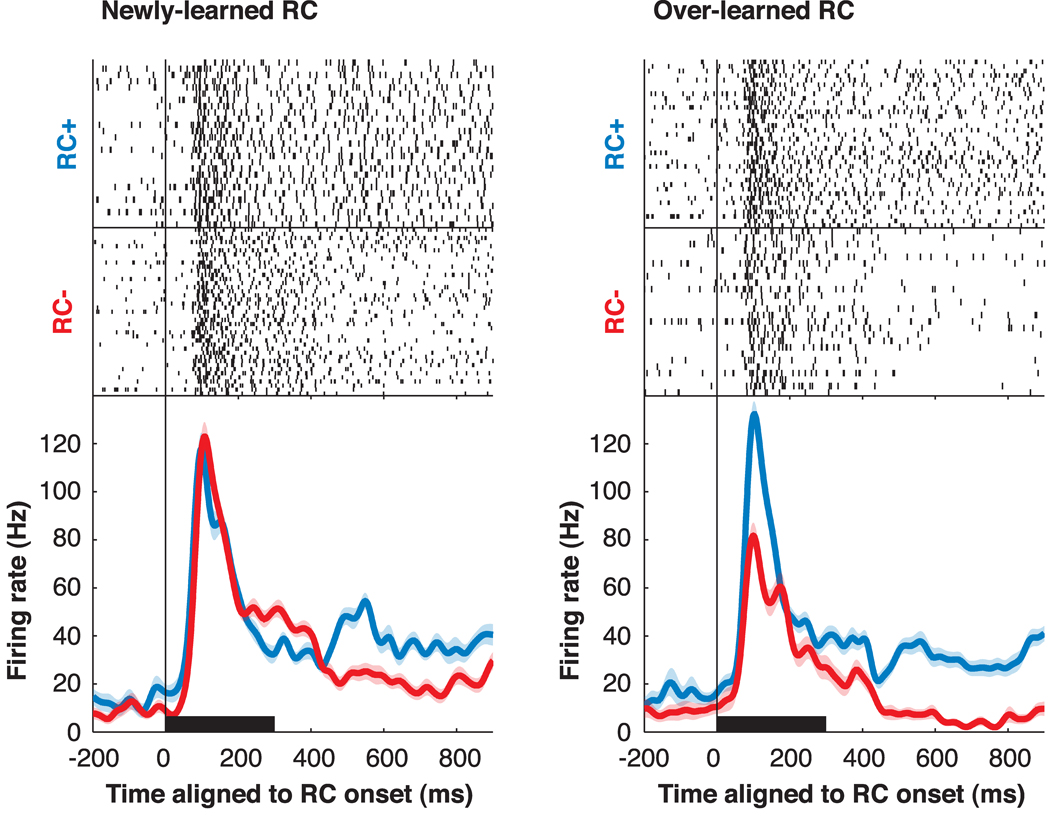
Figure 3.
Response of a representative neuron to newly-learned and over-learned RC in its RF. In the raster displays, each tick represents an action potential and each row a single correct trial. Trials are aligned on RC onset and truncated at the end of the delay period, and they are shown in chronological order with the first presentation at the top. Trials with distinct RC within a category are intermingled. The spike density traces (bottom panels) show the average firing rates for RC+ (blue) and RC− (red) trials, considering only trials after the learn point for each RC. Shading shows SEM. The black horizontal bar denotes RC duration.

