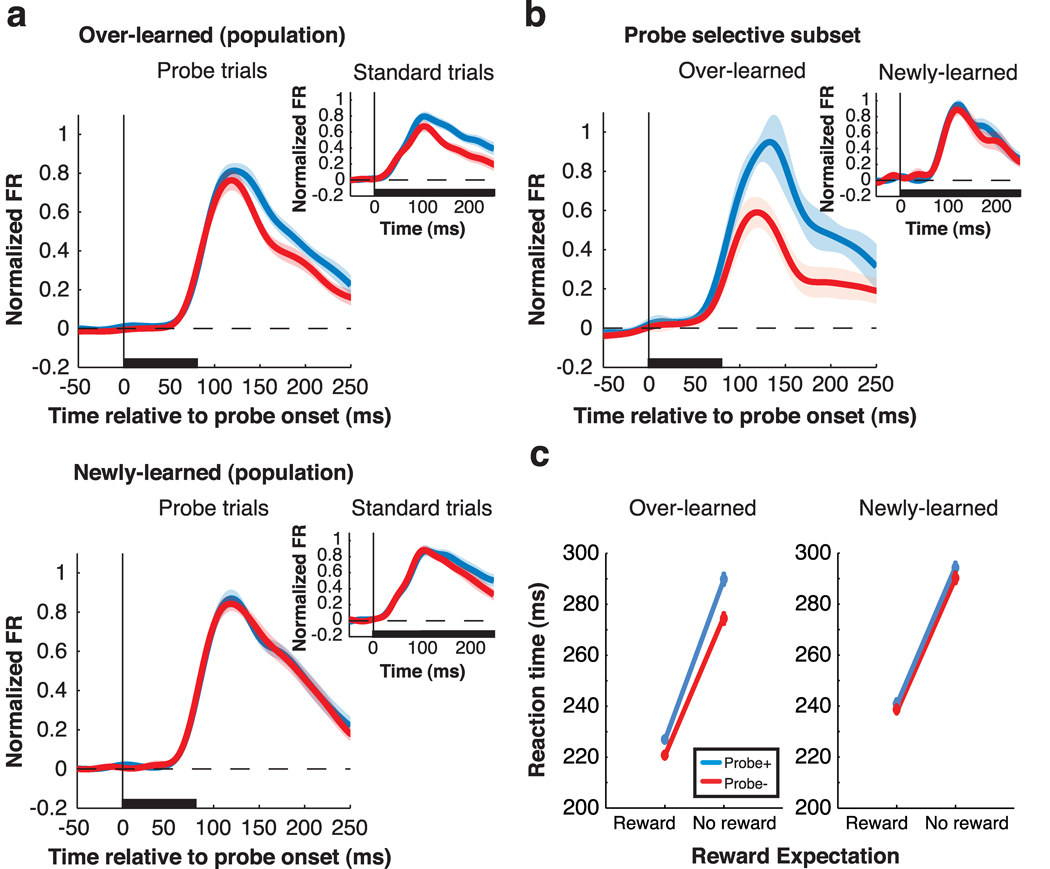
Figure 8.
Neural responses and saccade reaction times during the probe task. (a) Population neural response (n=34) during the probe task (main panels) and standard task (same 34 neurons; inset). Trials were sorted by learning history (over-learned: top, newly-learned: bottom) and the valence of the stimulus in the RF (blue: RC+; red: RC−). Responses to the probes are truncated at 250 ms – the average time at which the saccade moved the neuron’s RF away from the probe location. Responses during the standard task are truncated at 250 ms as well for the sake of comparison. Shading is ± SEM. (b) Average response of neurons with significant selectivity for the valence of over-learned probes (n= 15). Inset shows the responses of the same neurons for newly-learned probes. (c) Saccade reaction times during the probe task. Mean reaction times (±SEM) are plotted as a function of expected reward (x-axis) and probe valence (blue: probe+, red: probe−), separately for over-learned and newly-learned probes.

