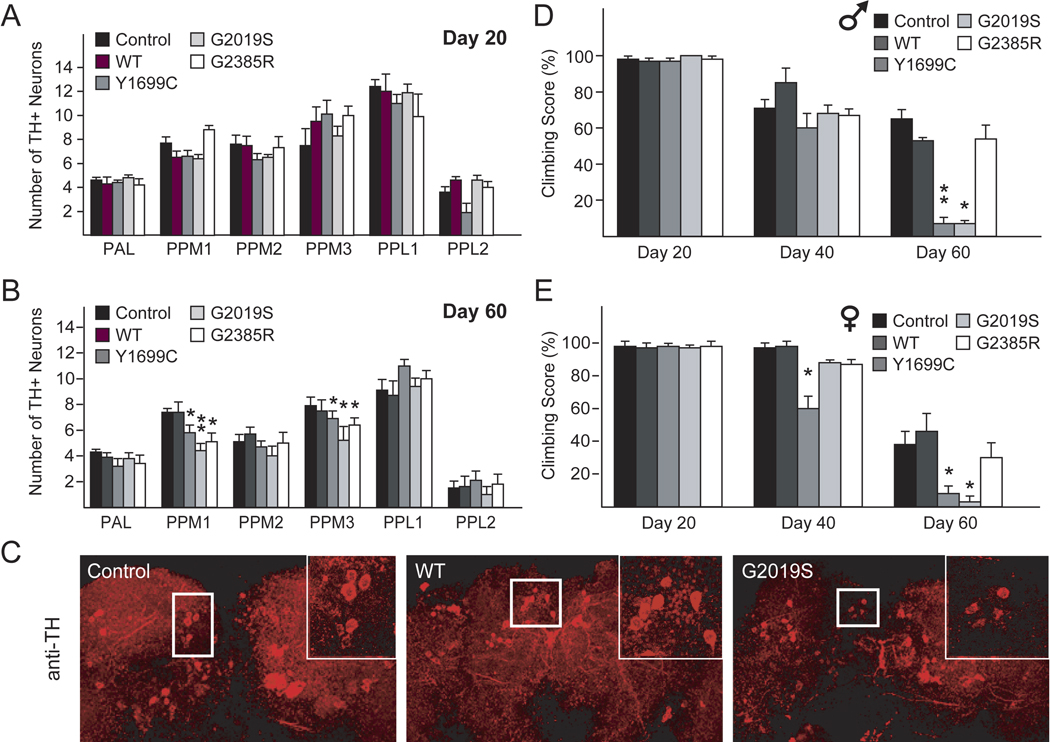
Figure 2. Expression of LRRK2 mutants in flies promotes DA neurodegeneration and concomitant locomotion deficits.
(A–B) Bar-graph showing the number of TH-positive DA neurons in different clusters of various fly species at 20 or 60 day post eclosion, as indicated (n=10). (C) Representative confocal microscopy images showing TH-positive (red) DA neurons in the PPM1 cluster (boxed) of 60-day-old control or LRRK2-expressing flies. Inset, higher magnification of boxed regions. (D–E) Bar graph showing the percentage of various (D) male and (E) female flies at different days post-eclosion that reached the top of assay column after 1 min. (n=20) (Genotype: ddc-Gal4/+ or ddc-Gal4-hLRRK2)

