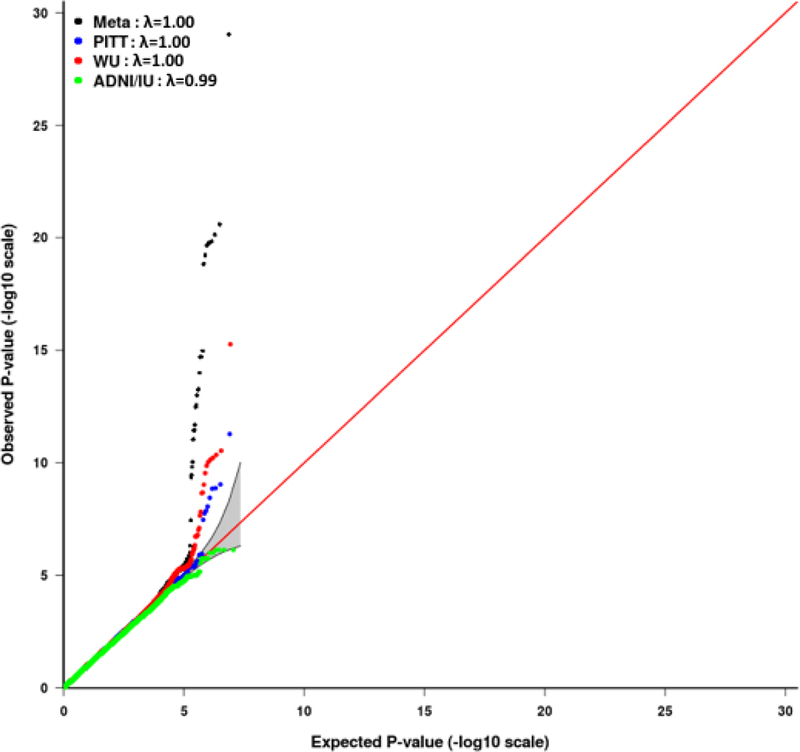
Figure 2a.

Quantile-quantile plot for the individual GWAS results in the University of Pittsburgh (PITT), Washington University (WU), and the Alzheimer’s disease Neuroimaging Initiative (ADNI) and the Indiana Memory and Aging Study (ADNI/IU) datasets and in the meta-analysis. λ is the genomic control value.
