Figure 2b.

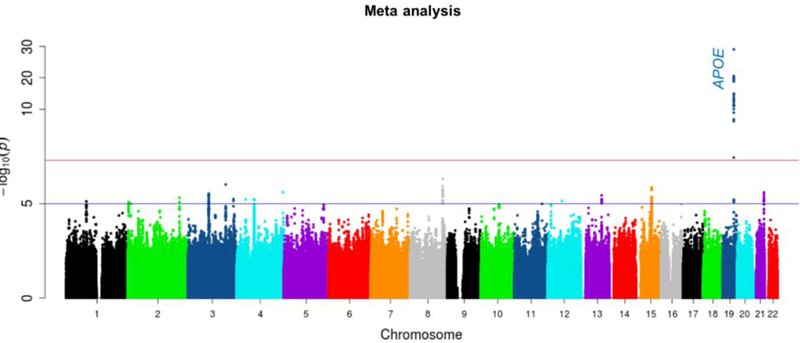
Manhattan plot showing the P-values in the meta-analysis. The blue line represents the suggestive significance line (P<E-05). The red line represents the significance threshold (P<5E-08).

Manhattan plot showing the P-values in the meta-analysis. The blue line represents the suggestive significance line (P<E-05). The red line represents the significance threshold (P<5E-08).