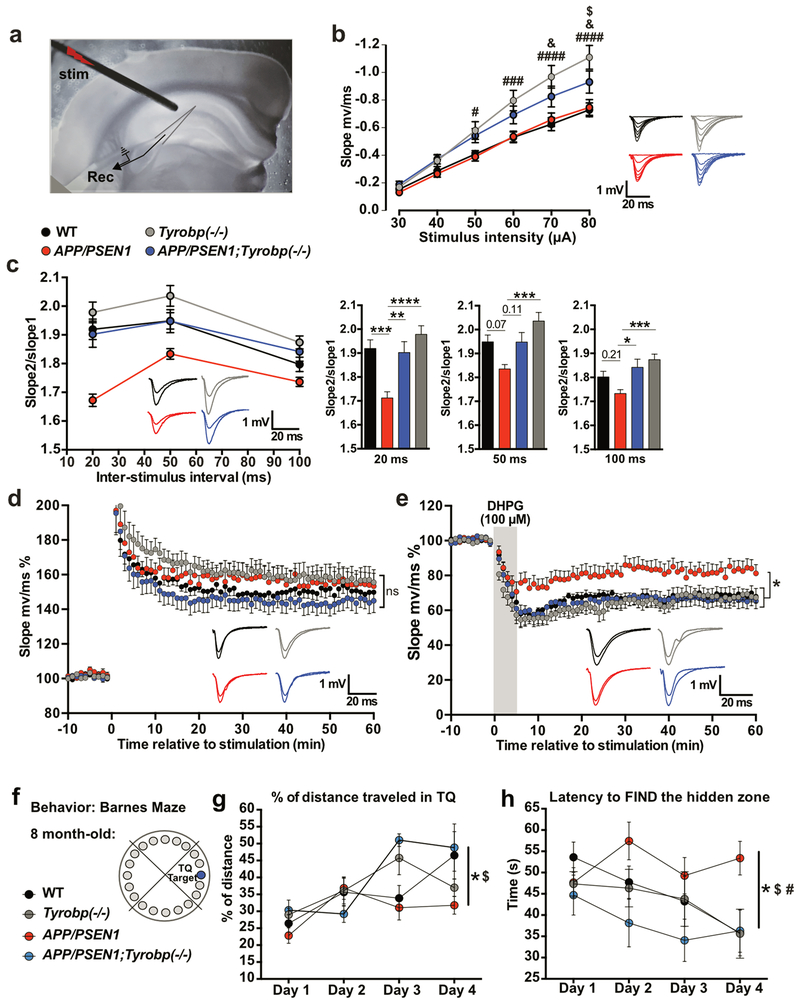
Figure 5. Constitutive deletion of Tyrobp normalizes altered synaptic plasticity and prevents defects in spatial learning behavior in 8-month-old APP/PSEN1 mice.
(a) Electrode placement for field recordings of synaptic potentials. A bipolar stimulating electrode (“stim”) was positioned above the Schaffer collaterals in area CA3, 150-200μm lateral to the recording electrode (Rec) in stratum radiatum of area CA1. (b) Basal input-output relationship for fEPSPs in 8-month-old WT (n=8 mice; 23 recordings), Tyrobp−/− (n=6 mice; 22 recordings), APP/PSEN1 (n=5 mice; 16 recordings), and APP/PSEN1;Tyrobp−/− (n=6 mice; 17 recordings) mice. Two-way ANOVA corrected for multiple comparisons (Tukey) was used for statistical comparisons. #p<0.05; ###p<0.001; ####p<0.0001 in Tyrobp−/− vs. WT and Tyrobp−/− vs. APP/PSEN1. &p<0.05 in APP/PSEN1;Tyrobp−/− vs. WT. $p<0.05 in APP/PSEN1;Tyrobp−/− vs. Tyrobp−/−. (c) Left panel: Paired-pulse facilitation (PPF) in 8-month-old WT (n=8 mice; 24 recordings), Tyrobp−/− (n=6 mice; 23 recordings), APP/PSEN1 (n=5 mice; 18 recordings), and APP/PSEN1;Tyrobp−/− (n=6 mice; 18 recordings) mice. Right panel: summary of PPF data. One-way ANOVA corrected for multiple comparisons (Tukey) was used for statistical comparisons. *p<0.05, **p<0.01; ***p<0.001; ****p<0.0001. (d) Synaptically induced long-term potentiation (LTP) in WT (n=7 mice; 11 recordings), Tyrobp−/− (n=6 mice; 12 recordings), APP/PSEN1 (n=5 mice; 9 recordings), and APP/PSEN1;Tyrobp−/− (n=6 mice; 9 recordings) mice. Two-way ANOVA corrected for multiple comparisons (Tukey) was used for statistical analysis over the final 5 minutes of recordings. (e) 3,5-dihydroxyphenylglyine (DHPG) induced long-term depression (LTD) in WT (n=5 mice; 8 recordings), Tyrobp−/− (n=6 mice; 11 recordings), APP/PSEN1 (n=5 mice; 10 recordings), and APP/PSEN1;Tyrobp−/− (n=5 mice; 9 recordings) mice. Two-way ANOVA corrected for multiple comparisons (Tukey) was used for statistical analysis over the final 5min of recordings. *p<0.05. Data presented as mean±SEM. (f) Spatial learning behavior in the Barnes Maze Test in 8-month-old APP/PSEN1 mice. 4 groups of 8-month-old mice were used: wild-type (WT) (n=9), Tyrobp−/− (n=12), APP/PSEN1 (n=17), or APP/PSEN1;Tyrobp−/− (n=6). (g) Percentage of distance traveled in the target quadrant (TQ). (h) Latency (in seconds) to find the hidden zone. One-way ANOVA on the day 4 was used for statistical comparisons, *p<0.05 in APP/PSEN1 vs. WT; $p<0.05 in APP/PSEN1 vs. APP/PSEN1;Tyrobp−/−; #p<0.01 in APP/PSEN1 vs. Tyrobp−/−. Data presented as mean±SEM

