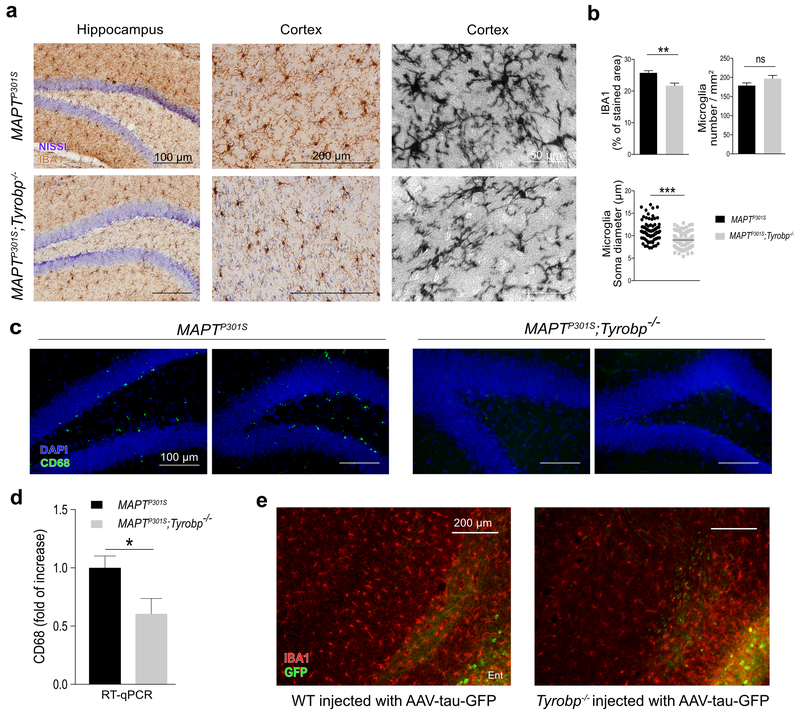
Figure 3: TYROBP deficiency alters microglia phenotype.
a. Representative images of anti-Iba1 DAB immunohistochemistry in 4-month-old MAPTP301S mice with (top) and without (bottom) TYROBP. Scale bars = 100, 200 and 50 μm respectively.
b. Top left panel: quantification of IBA1 immunoreactivity in cortical areas (n = 4 mice per group with an average of 4-5 slices per mouse). Top right panel: average microglia density (cells/mm2 ; n = 4 mice per group with an average of 4-5 slices per mouse). Bottom panel: diameter of microglial soma in cortex. n = 20 microglia per mouse and area with n = 4 (MAPTP301S) or n=5 (MAPTP301S;Tyrobp−/−) mice per group.
c. Representative images of anti-CD68 immunohistochemistry in the hippocampus of the same groups as in Figure 3(a). Scale bar = 100 μm.
d. RT-qPCR of CD68 mRNA in the prefrontal cortex in the same mice as in Figure 3(a) with n = 4 mice per group.
e. Representative images of immunohistochemistry with anti-Iba1 antibody in WT or Tyrobp-null mice injected with AAV-tau-GFP in the medial entorhinal cortex (see Figure 2 and Supplementary Figure 3). Scale bar = 200 μm.
Error bars represent means ± SEM. Males and females were used for experiments, and results were combined for analysis. Statistical analyses were performed using a Student’s t-test, **p<0.01; ***p<0.001.

