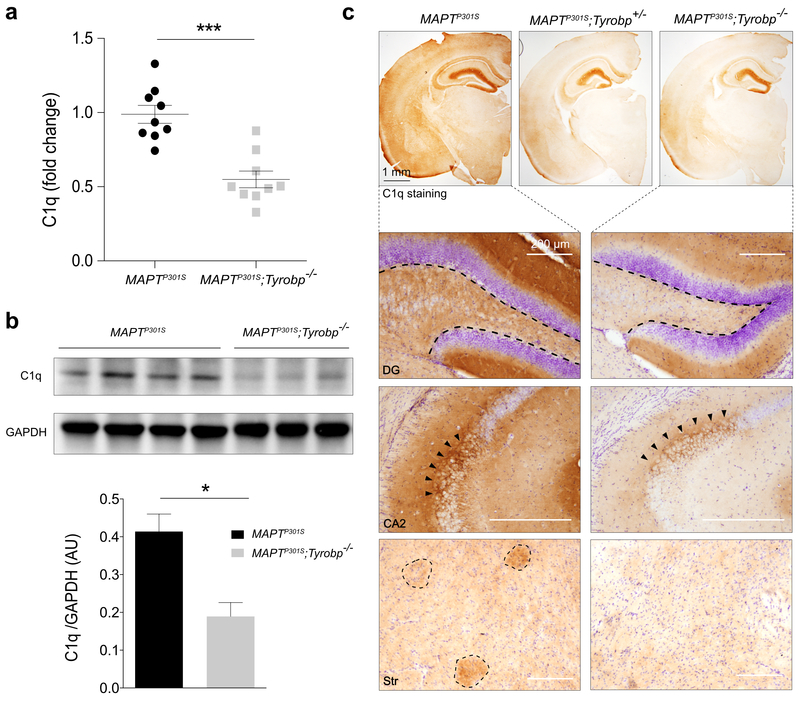
Figure 4: TYROBP deficiency is associated with decreased C1q RNA and protein levels.
a. RT-qPCR analysis for C1q in MAPTP301S mice with normal or absent TYROBP. Assay was performed on prefrontal cortex samples from males and females. n = 9 mice per group.
b. Western blot and densitometric analysis of C1q protein in cortical samples. n = 4 (MAPTP301S) or n=3 (MAPTP301S;Tyrobp−/−) mice per group.
c. Representative images of anti-C1q immunohistochemistry, showing intense immunoreactivity in cells of the hippocampus and in a nerve terminal-like pattern in the dentate gyrus (DG) and in region CA2. C1q-immunopositive patches are visualized in the cortex and striatum. Scale bar = 200μm. Immunostaining intensity in all regions is decreased in the indicated regions of Tyrobp−/− mice.
Males and females (4 months of age) were used for experiments, and results were combined for analysis. Error bars represent means ± SEM. Statistical analyses were performed using a Student’s t-test, *p<0.05; ***p<0.001.

