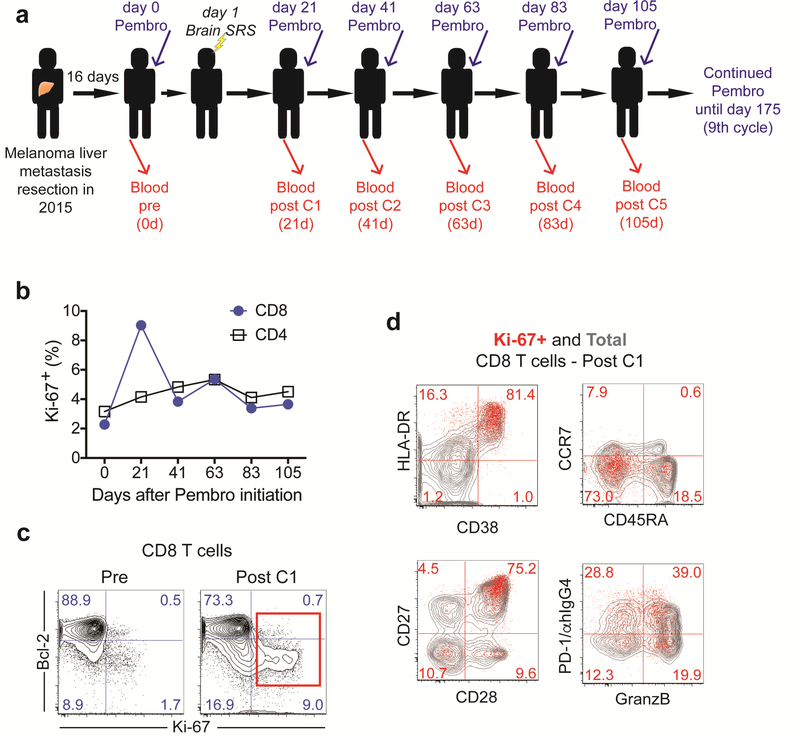
Fig. 1:
CD8 T cell activation in peripheral blood. (a) Scheme shows treatment and blood sampling schedule. (b) Proliferation of CD4 and CD8 T cells (c) Ki-67 and Bcl-2 expression on CD8 T cells prior to treatment and post cycle 1. Numbers represent frequency among total CD8 T cells. (d) Phenotypic analysis of proliferating CD8 T cells on day 21 post treatment initiation. Numbers represent frequency among Ki-67+ CD8 T cells. Contour plots show total CD8 T cells (grey contour plot) and Ki-67+ CD8 T cells (red dots). C: cycle, Pembro: Pembrolizumab, d: days

