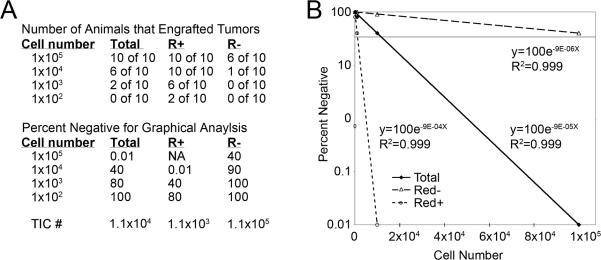
Figure 2.
Limiting dilution cell transplantation analysis. Tumor cells are introduced into recipient animals at various doses. In this hypothetical example, the tumor is comprised of two subpopulations of cells (R+ v. R−). The number of animals that engraft disease from unfractionated tumor cells (Total) compared to fractionated cells (R+ or R−) are shown in the top of panel A. Data is converted into the percentage of animals that fail to engraft disease (bottom, A) and plotted graphically (B). Specifically, percent negative is plotted as a log scale and cell number is on the X-axis. Linear regression is completed, an equation is fit to the data, and R2 values denote the accuracy of the data. A line at 37% negative denotes the number of cells in which one self-renewing cell resides. For the Total cell population, this line crosses at 1.1×10⁴, indicating that 1 in 1.1×10⁴ cells is capable of self-renewal. Tumor-initiating cell number (TIC #) in this illustrative example is shown in the extreme bottom, panel A.

