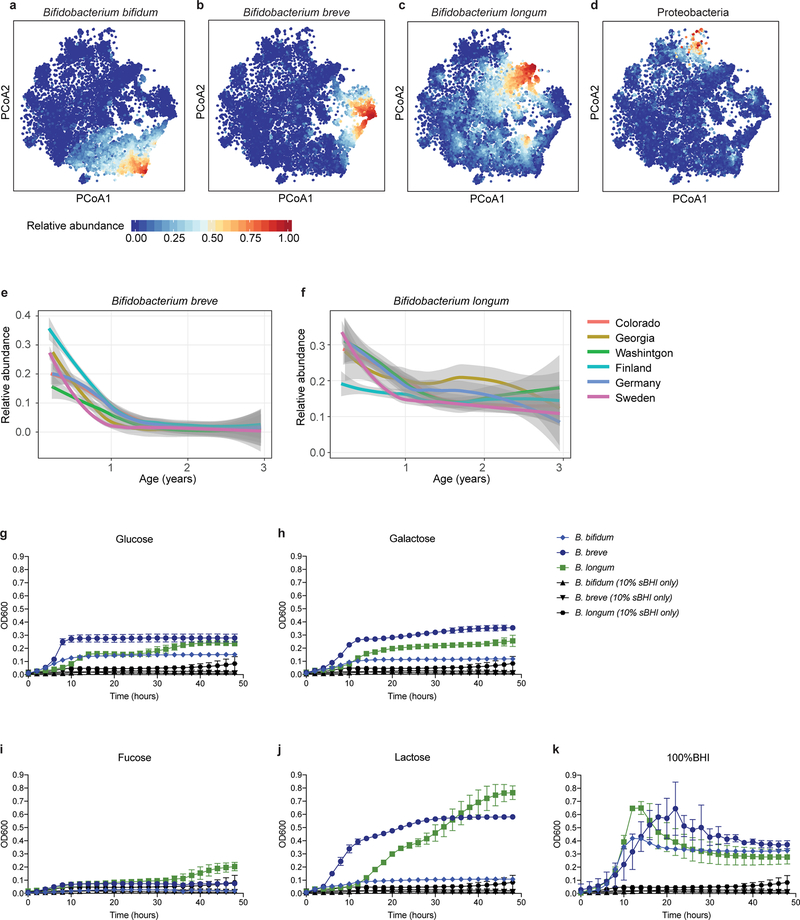
Extended Data Figure 1: Heterogeneity in early taxonomic profiles.
a-d, Relative abundances of taxonomic groups highlighted by weighted averages in Fig. 2a (arrows) shown separately (N = 10,913 samples). e,f, Average longitudinal abundance of B. breve (e) and B. longum (f) per clinical center (N = 10,194 samples). The curves show locally weighted scatterplot smoothing (LOESS) for the relative abundances and shaded area shows 95% confidence interval for each fit, as implemented in geom_smooth function in ggplot2 R package. g-k, Growth curves of human infant isolates of B. breve, B. bifidum and B. longum grown individually in low-nutrient medium (10% sBHI) supplemented with single carbon sources (glucose (g), galactose (h), fucose (i) and lactose (j) or grown in 100% sBHI (k). As a negative control, growth curves of each strain grown in 10% BHI without additional sugar are shown in black for each condition. Data are representative of three (N = 3) independent experiments and are presented as the mean (and SD) of triplicate assessments.

