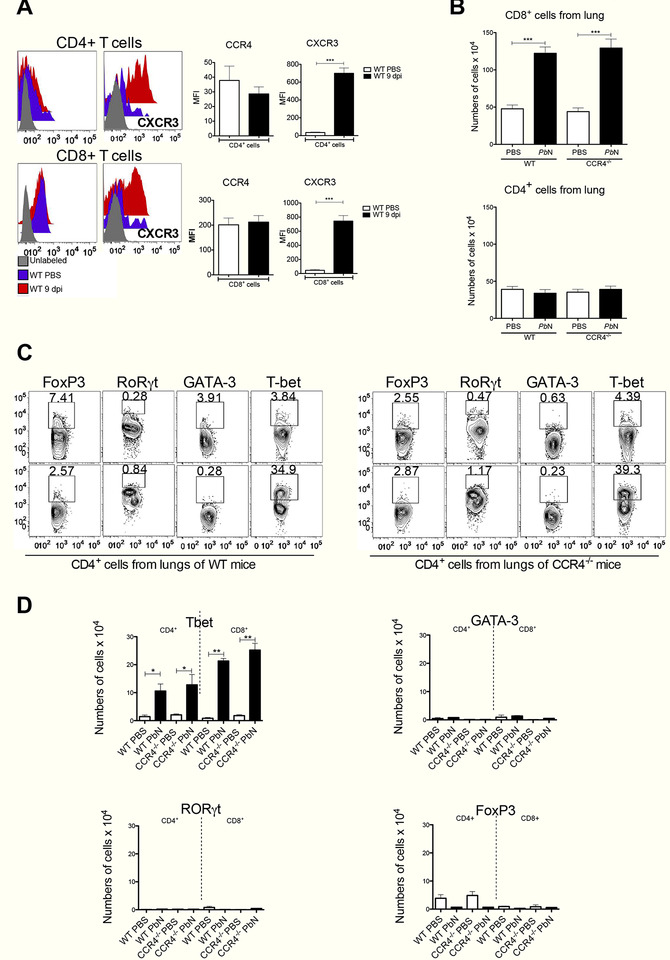
Figure 2. MA-ARDS/ALI is primarily associated with CXCR3+ and Tbet+ T cells.
(A) Expression of CCR4 (left panels) and CXCR3 (right panels) on CD4+ T cells (top panels) or CD8+ T cells (bottom panels) from uninfected and PbN-infected C57BL/6 mice. Graphs indicating MFI of the CCR4 and CXCR3 expression by CD8+ and CD4+ are shown in the right. (B) Total number of CD8+ (top panel) and CD4+ (bottom panel) T cells in the lungs of WT and CCR4−/− mice infected with PbN. (C) Intracellular staining of the transcription factors Tbet, GATA-3, RORγ and FoxP3 in CD4+ T cells from uninfected controls (top panels) or PbN-infected (bottom panels) WT (left panels) and CCR4−/− mice (right panels). (D) Total number of Tbet+ (left top), GATA-3+ (right top), RORγt+ and FoxP3+ (right bottom) CD4+ T and CD8+ T cells in the lungs of uninfected controls (white bars) and PbN-infected (black bars) WT and CCR44C4 mice. Data (A–D) are representative of at least two independent experiments (n = 4–6 mice per group).

