Figure 2.

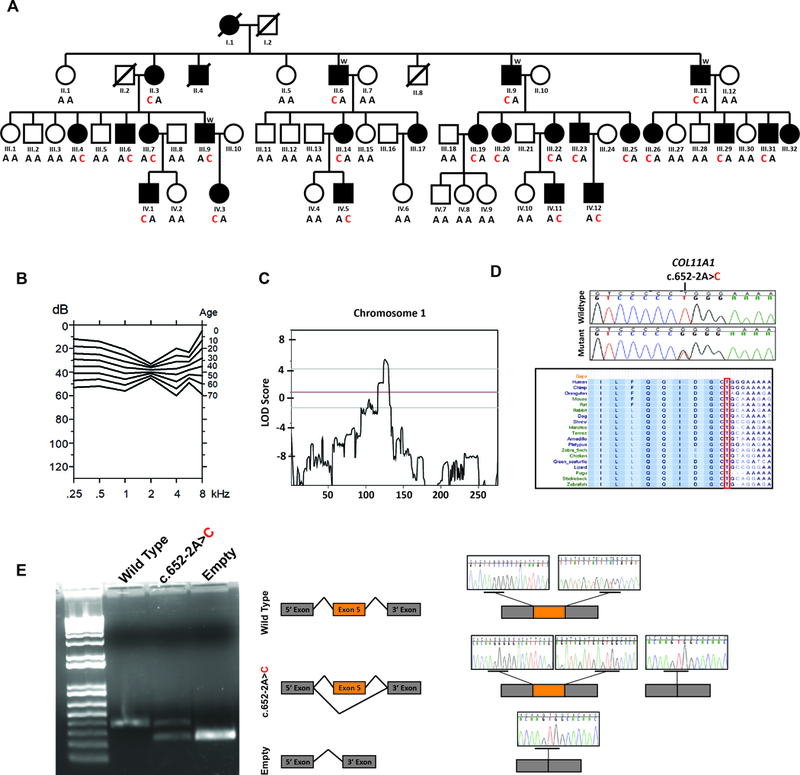
COL11A1 gene and protein schematic denoting reported pathogenic variants and their associated phenotypes. All variants were collected from the Deafness Variation Database (DVD; http://deafnessvariationdatabase.org/). The grey box shows the alternatively spliced exons. Text colored blue, black, green and orange indicates the phenotypes associated with pathogenic variants in COL11A1: STL2, FBCG1, MRSHS and STL2/MRSHS, respectively. Missense variants are in italics and nonsense variants are underlined. An “*” denotes a synonymous change, while “**” represents in-frame indels. The position of the c.652–2A>C mutation is shown in red and bold. Nucleotide numbering: the A of the ATG translation initiation site is noted as +1 using transcript NM_001854.3.
