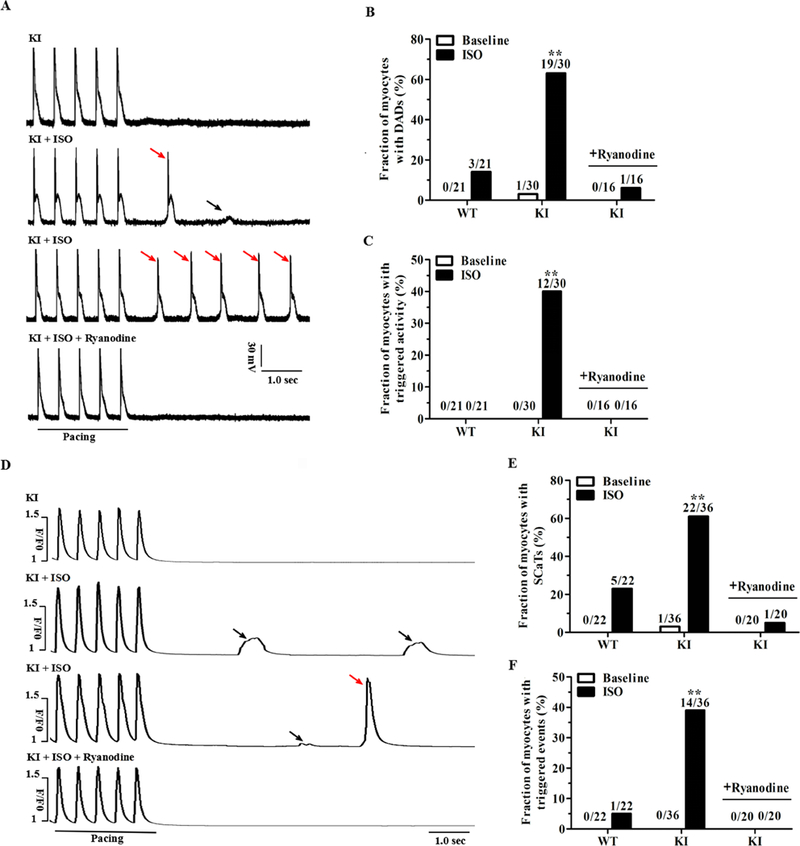
Figure 4. KI cardiomyocytes display stress-induced delayed afterdepolarizations and spontaneous Ca2+ release.

(A) Representative traces of action potentials in KI cardiomyocytes ± 1 μM ISO and/or 100 nM ryanodine. Small DADs (denoted by black arrow) and triggered activity (denoted by red arrows) were recorded following a stimulation pause after a 2-Hz field stimulation. (B-C) Cumulative incidence of DADs (B) and triggered activity (C) in WT and KI cardiomyocytes (n = 16 to 30 cells per group from 5 hearts/genotype, **P < 0.01 versus WT + ISO or versus KI + ISO + ryanodine). (D) Representative traces of the occurrence of SCaTs (denoted by black arrows) and triggered beats (denoted by red arrow) following a stimulation pause after 2-Hz field stimulation in KI cardiomyocytes ± 1 μM ISO and/or 100 nM ryanodine. (E-F) Cumulative incidence of SCaTs (E) and triggered beats (F) in WT and KI cardiomyocytes (n = 20 to 36 cells per group from 5 hearts/genotype, **P < 0.01 versus WT + ISO or versus KI + ISO + ryanodine). WT = wild type, KI = knock-in, SR = sarcoplasmic reticulum, DADs = delayed afterdepolarizations, SCaTs = spontaneous Ca2+ transients, ISO = isoproterenol, sec = seconds.
