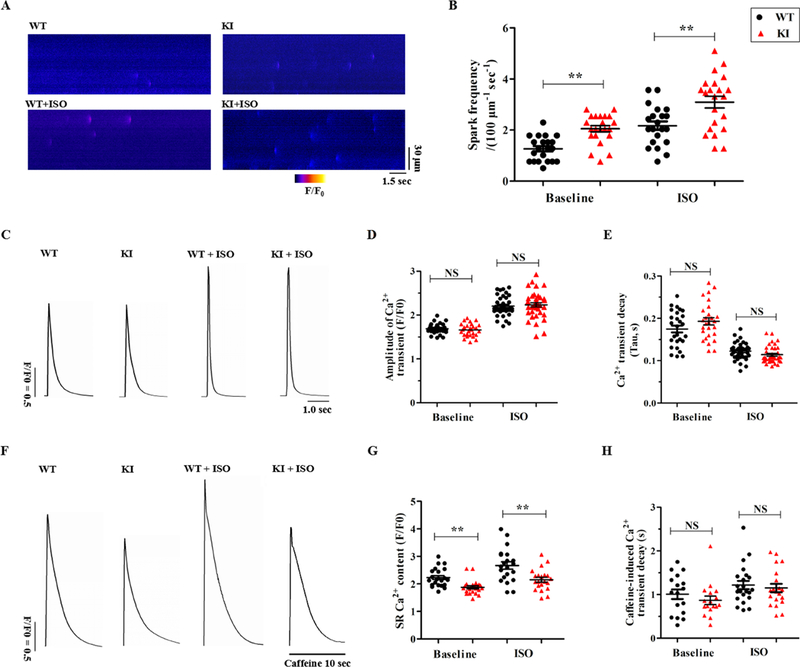
Figure 5. KI cardiomyocytes display an increased Ca2+ spark frequency and reduced SR Ca2+ content.

(A) Representative line-scan images of Ca2+ sparks in WT and KI cardiomyocytes ± 1 μM ISO. (B) Cumulative data of the Ca2+ spark frequency in WT and KI cardiomyocytes (n = 21 to 22 cells per group from 5 hearts/genotype, **P < 0.01). (C) Representative traces of field-stimulated Ca2+ transients in WT and KI cardiomyocytes ± 1 μM ISO. (D-E) Cumulative data of the amplitude of field-stimulated Ca2+ transients (D, P = NS) and decay-time constants (E, P = NS) in WT and KI cardiomyocytes ± 1 μM ISO (n = 27 to 37 cells per group from 5 hearts/genotype). (F) Representative traces of caffeine-induced Ca2+ transients in WT and KI cardiomyocytes ± 1 μM ISO. (G-H) Cumulative data of the amplitude of caffeine-induced Ca2+ transients (i.e., SR Ca2+ content, G, **P < 0.01) and decay-time constants (H, P = NS) in WT and KI cardiomyocytes ± ISO (n=17 to 22 cells per group from 5 hearts/genotype). WT = wild type, KI = knock-in, ISO = isoproterenol, SR = sarcoplasmic reticulum, NS = not significant, sec = seconds.
