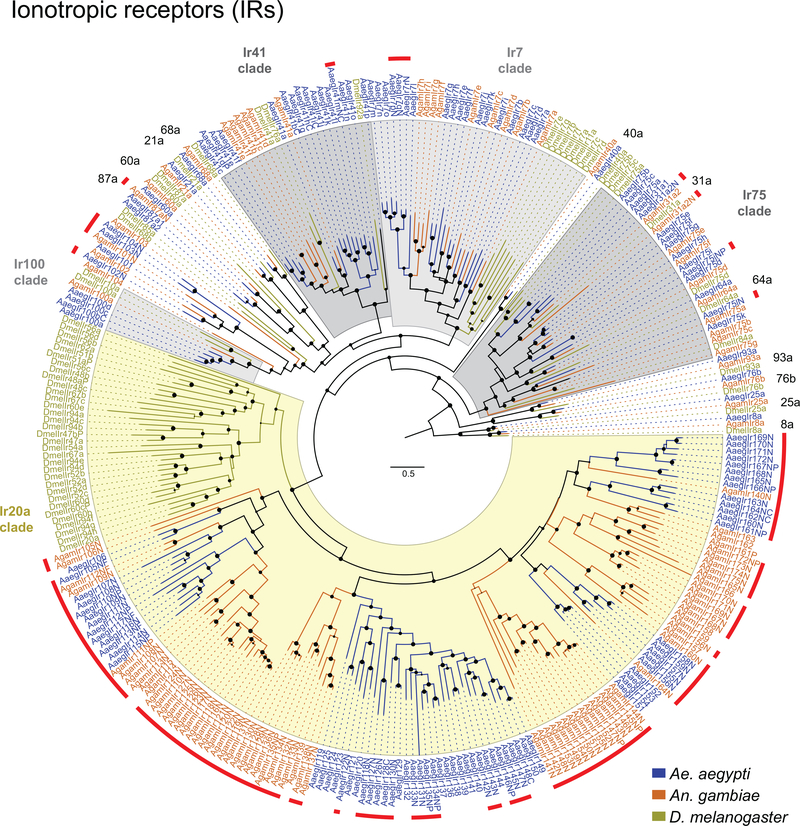
Extended Data Figure 6 |. Phylogenetic trees of the ionotropic receptor (IR) gene families from Ae. aegypti, An. gambiae, and D. melanogaster.
Maximum likelihood phylogenetic tree of IR protein sequences from the indicated species rooted with highly conserved Ir8a and Ir25a proteins. Conserved proteins with orthologues in all species are named outside the circle, and previously unannotated IRs are highlighted with red lines. Suffixes after protein names: C – minor assembly correction, F – major assembly modification, N – new model, and P – pseudogene. Scale bar: amino acid substitutions per site. Filled circles on nodes indicate support levels from approximate likelihood ratio tests from 0–1.

