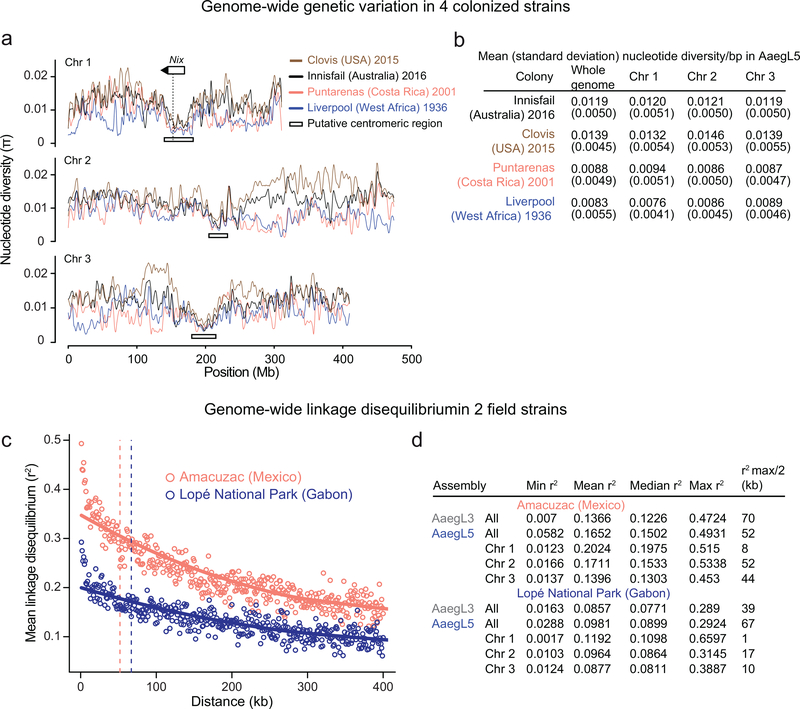
Extended Data Figure 9 |. Population genomic structure and QTL analysis of Ae. aegypti strains.
a, Chromosomal patterns of nucleotide diversity (π) in four strains of Ae. aegypti measured in 100 kb non-overlapping windows and presented as a LOESS-smoothed curve (Extended Data Fig. 9a-b). b, Mean nucleotide diversity in four colonized strains of Ae. aegypti, with standard deviation indicated in parentheses. Nucleotide diversity (π) was measured in non-overlapping 100 kb windows. The Liverpool and Costa Rica colonies maintain extensive diversity despite being colonized in the laboratory more than a decade ago, but show reduced genome-wide diversity (on the order of 30–40%) relative to the more recently laboratory colonized Innisfail and Clovis c, Pairwise linkage disequilibrium (LD) between SNPs located within the same chromosome estimated from 28 wild-caught individuals from the indicated populations. Each point represents the mean LD for that set of binned SNP-pairs. Solid lines are LOESS-smoothed curves, and dashed lines correspond to r 2 max /2 (Extended Data Fig. 9a-b). Inclusion of additional individuals available from the Amacuzac population (up to 137) had a minimal effect on the LD estimations (ΔR2 < 0.017; data not shown). d, Table of linkage disequilibrium (r2) values along the Ae. aegypti AaegL5 genome assembly based on pairwise SNP comparisons. Data were obtained from the average r2 of SNPs in 1 kb bins.

