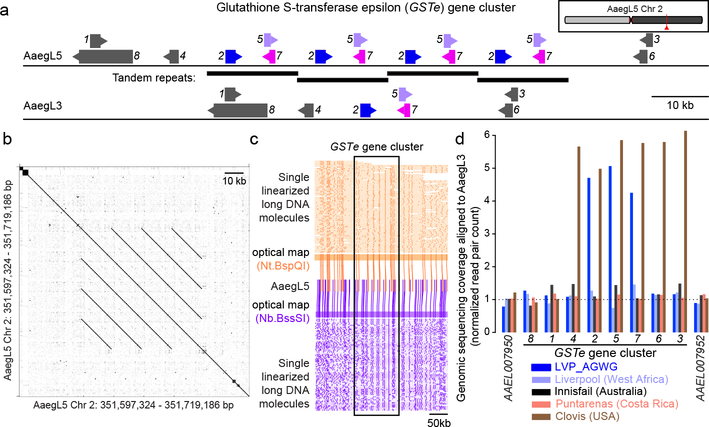
Figure 4 |. Copy-number variation in the glutathione S-transferase epsilon gene cluster.
a, Glutathione S-transferase epsilon (GSTe) gene cluster structure in AaegL5 vs. AaegL3 (Supplementary Data 23). Arrowheads indicate gene orientation. b, Dot-plot alignment of AaegL5 GSTe region to itself. c, Optical mapping of DNA labelled with indicated enzymes. DNA molecules are cropped at edges for clarity. d, Genomic sequencing coverage of AaegL3 GSTe genes (DNA read pairs mapped to each gene, normalized by gene length in kb) from one LVP_AGWG male and pooled mosquitoes from 4 other laboratory strains.

