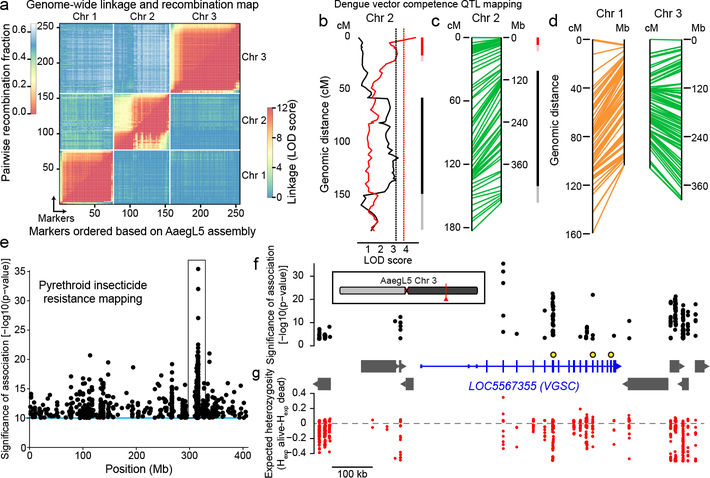
Figure 5 |. Deploying the AaegL5 genome for applied population genetics.
a, Heat map of linkage based on pairwise recombination fractions for 255 RAD markers ordered by AaegL5 physical coordinates. b, Significant chromosome 2 QTL underlying systemic DENV dissemination in midgut-infected mosquitoes (Extended Data Fig. 10a). Curves represent log of the odds ratio (LOD) scores obtained by interval mapping. Dotted vertical lines indicate genome-wide statistical significance thresholds (α=0.05). Confidence intervals of significant QTLs [bright colour: 1.5-LOD interval; light colour: 2-LOD interval with generalist effects (black, across DENV serotypes and isolates) and DENV isolate-specific effects (red, indicative of genotype-by-genotype interactions)]. c-d, Synteny between linkage map (in cM) and physical map (in Mb) for chromosome 2 (c) and chromosomes 1 and 3 (d). e, Chromosome 3 SNPs significantly correlated with deltamethrin survival. f-g, Zoomed in and inverted view of box in (e) centred on new gene model of voltage-gated sodium channel (VGSC, transcript variant X3, chromosomal position indicated in red). (f). Non-coding genes are omitted for clarity, and other genes indicated with grey boxes. VGSC exons are represented by tall boxes and UTRs by short boxes. Arrowheads indicate gene orientation. Non-synonymous VGSC SNPs marked with larger black and yellow circles: (V1016I = 315,983,763, F1534C= 315,939,224, V410L = 316,080,722). Difference in expected heterozygosity (Hexp alive – Hexp dead) for all SNPs (g).

