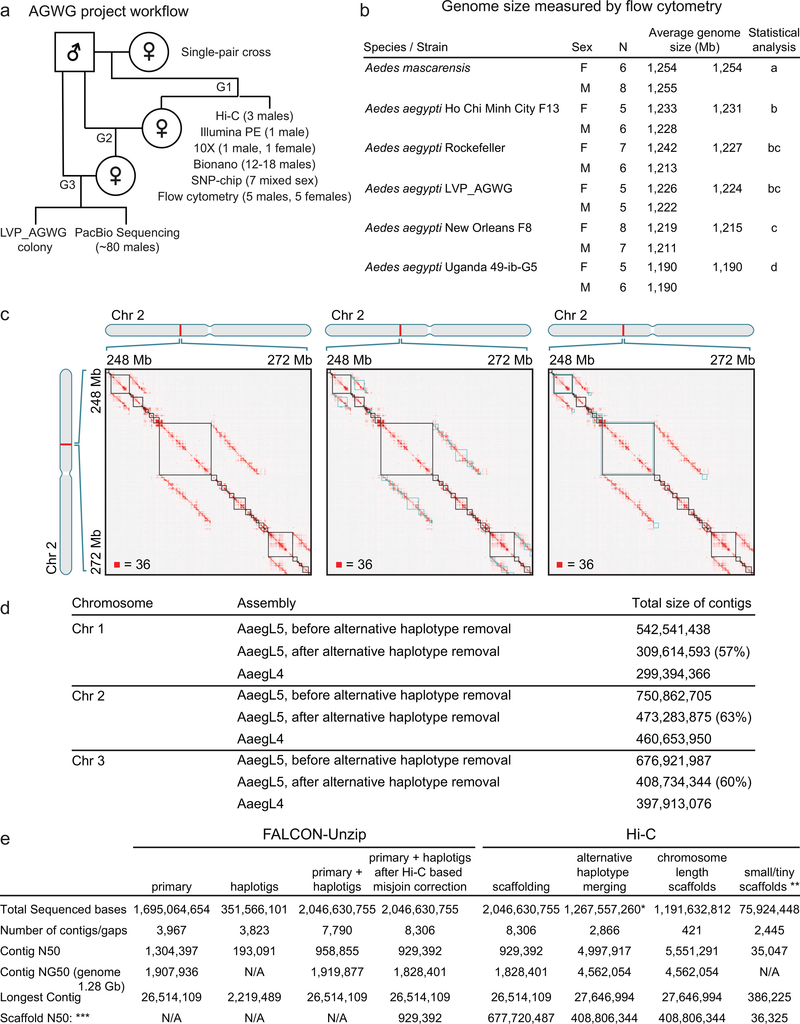
Extended Data Figure 1 |. Project flowchart, measured genome size, and assembly process.
a, Flowchart of LVP_AGWG strain inbreeding, data collection, and experimental design of the AaegL5 assembly process. b, Estimated average 1C genome size for each strain for 5 Ae. aegypti strains and Ae. mascarensis, the sister taxon of Ae. aegypti whose genome size has not previously been measured. There were no significant differences between the sexes within and between the species/strains analysed (p > 0.2). Significant differences between strains were determined using Proc GLM in SAS with both a Tukey and a Scheffé option with the same outcome. Data labelled with different letters are significantly different (p < 0.01). c, Combining Hi-C maps with 2D annotations enabled efficient review of sequences identified as alternative haplotypes by sequence alignment. The figure depicts a roughly 24 Mb x 24 Mb fragment of a contact map generated by aligning a Hi-C data set to an intermediate genome assembly generated during the process of creating AaegL5. This intermediate assembly was a sequence comprising error-corrected, ordered and oriented FALCON-Unzip contigs. The intensity of each pixel in the contact map correlates with how often pair of loci co-locate in the nucleus. Maximum intensity is indicated in the lower left of each panel. These maps include reads that do not align uniquely (reads with zero mapping quality); such alignments are randomly assigned to one of the possible genomic locations. Three panels show three types of annotations that are overlaid on top of the contact map. (left) FALCON-Unzip contig boundaries are highlighted as black squares along the diagonal. Notably, large linear features appear above and below the diagonal. These are the result of sequence overlap among contigs, which can indicate the presence of undercollapsed heterozygosity in the contig set. Because reads that do not map uniquely are randomly assigned during the alignment step, Hi-C reads derived from a contig will sometimes be aligned to an overlapping contig. When this happens, the Hi-C read pair may contribute to the formation of a linear feature above and below the diagonal. Thus, the linear stretches of enriched contact frequency parallel to the diagonal are brought about by the random assignment procedure, and can facilitate the detection of pairs of overlapping contigs. Note that, when the overlap between contigs is due to undercollapsed heterozygosity, both contigs will exhibit similar long-range contact patterns. This aspect of Hi-C data also provides evidence for the presence of undercollapsed heterozygosity. (centre) LASTZ-alignment-based annotations for fully redundant contigs. The squares shown in blue are obtained by taking diagonal contig boundary annotations (in black) and shifting them up (respectively, left) when drawing above (resp., below) the diagonal so that the overlapping sequences are horizontally (resp., vertically) aligned. Note that, as expected, the squares typically span linear, off-diagonal features in the Hi-C data. When one contig is entirely contained in another contig, the redundant contig does not contribute sequence to the merged chromosome-length scaffolds. (right) LASTZ-alignment-based annotations for partially redundant contigs. Again, the squares shown in blue are obtained by taking diagonal contig boundary annotations (in black) and shifting them up and left. The overlaps shown in this panel correspond to contigs that only partially overlap in sequence with other contigs. Consequently, some of their sequence is incorporated in the final fasta. d, Comparison of chromosome lengths between AaegL4 and AaegL5. Numbers are given prior to post-Hi-C polishing and gap closing. e, Step-wise assembly statistics for Hi-C scaffolding, alternative haplotype removal and annotation. *Removed length: 779,073,495 bp. **See (ref. 6) for definition of scaffold groups. ***Gaps between contigs were set to 500 bp for calculating scaffold statistics.

