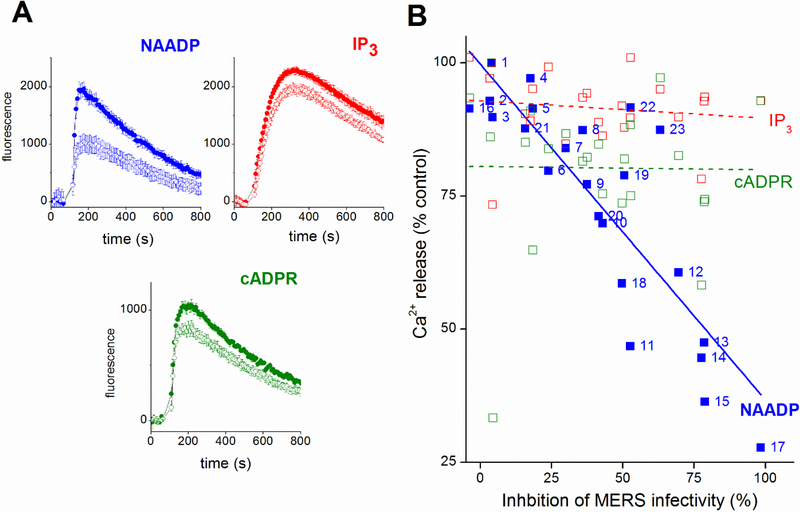
Figure 1. Drugs that inhibit NAADP-evoked Ca2+ release block MERS translocation.
A, Ca2+ release in sea urchin egg homogenate as resolved by fluo-3 fluorescence measurements. Ca2+ liberation was measured in the absence (solid circles, top trace) or presence of fangchinoline (open circles, 10μM) in response to NAADP (blue, 70nM), IP3 (red, 200nM) or cADPR (green, 100nM). Data represent values from a minimum of three independent experiments and are expressed as mean ± SEM. B, correlation plot comparing the extent of inhibition of NAADP- (blue) IP3- (red) or cADPR-evoked Ca2+ release (green) observed with individual ligands (10μM) correlated with the extent of inhibition of MERS-pseudovirus translocation evoked by the same ligands (at the same concentration, 10μM). None of these tested ligands evoked Ca2+ release by themselves. Solid (NAADP) and dotted lines (IP3, cADPR) represent linear regression of datapoints. Ligand key: 1=DMSO, 2=Cycleanine, 3=Tubocurarine, 4=Nimodipine, 5=Procaine, 6=Chondocurine, 7=Benzocaine, 8=Hernandezine, 9=Berbamine, 10=Nicardipine, 11=Verapamil, 12=Tetrandrine, 13=Fangchinoline, 14=Amitriptyline, 15=Loperamide, 16=Ned-19, 17=Bafilomycin, 18=U18666A, 19=YM201636, 20=Fluoxetine, 21=Citalopram, 22=Desipramine, 23=Siramesine. MERS-pseudovirus infectivity was measured using a luciferase-based cell entry assay, assay methodology and inhibition of NAADP-evoked Ca2+ shown in this figure are described in detail in the companion paper [25].

