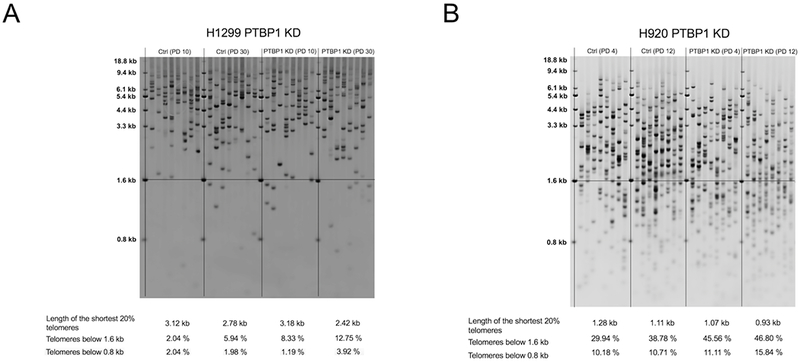
Figure 4: Telomere length analysis in stable knockdown PTBP1 cancer lines.

Telomere Shortest Length Assay, TeSLA, was performed to quantitatively assess long term effects of PTBP1 KD in the cancer lines H1299 and H920. (A) and (B) Stable shRNA H1299 and H920 along with control cells were analyzed with TeSLA. Telomere lengths for both control and PTBP1 KD H1299 cells were measured at population doubling 10 and 30 (PD10 and PD30). Telomere lengths for both control and PTBP1 KD H920 cells were measured at PD4 and PD12. Data are indicated in the tables below blots. Telomere bands were automatically detected and quantified with accompanying TeSLA software. Each lane represents a separate PCR replicate. In total 8 lanes/replicates per sample.
