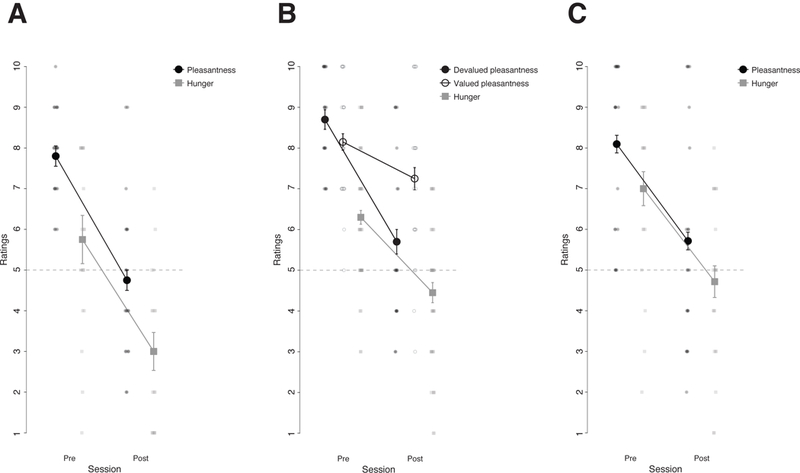
Figure 3. Manipulation check of the outcome devaluation procedure.

A, C, Mean ratings of hunger and the pleasantness of the snack before and after selective satiation for the group that underwent to the outcome devaluation procedure in Experiment 1 (A) and Experiment 3 (C). B, Mean ratings of hunger and of the pleasantness of the snack that was devalued through the selective satiation procedure (i.e., Devalued) and the snack that was not (i.e., Valued) in Experiment 2. Error bars indicate the within subject standard error of the mean. Plots of Experiments 1 to 2 are based on two different sets of 20 participants. Plot from Experiment 3 is based on data from 21 participants.
