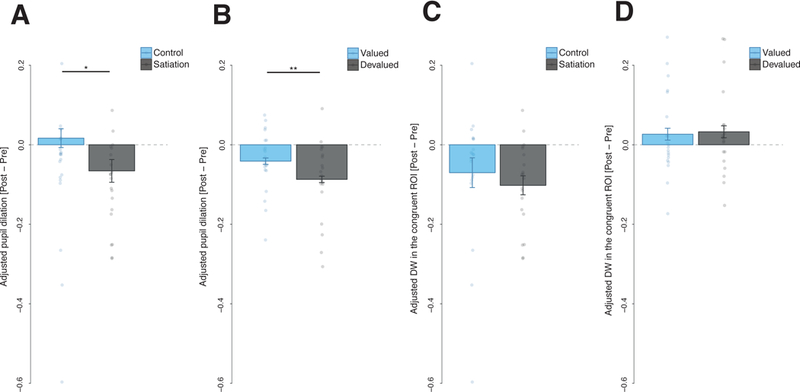
Figure 4. Effects of the outcome devaluation procedure on different conditioned responses during Experiment 1 and Experiment 2.

A–B, Adjusted pupil dilation before and after the outcome devaluation procedure: in (A) Experiment 1, *F(1,38) = 4.93, p = .032, η2p = .115, 90% CI [.005, .276] and (B) Experiment 2, **F(1,19) = 8.08, p = .010, η2p = .298, 90% CI [.045, .504]. Bars represent a change score in the pupil dilation induced by the outcome devaluation procedure (change score = adjusted pupil dilation after satiation – adjusted pupil dilation before satiation). C–D Adjusted Dwell Time (DW) spent in the Region of Interest (ROI) congruent with the CS+ prediction (i.e., left ROI for the CS+ predicting the outcome delivery to the left and right ROI for the CS+ predicting the outcome delivery to the right) before and after the outcome devaluation procedure in Experiment 1 (C) and Experiment 2 (D). Bars represent the change score in dwell time induced by outcome devaluation (change score = adjusted dwell time in the after satiation – adjusted dwell time before satiation). Results depicted from Experiment 1 are shown separately for the CSs+ in the satiation group that underwent outcome devaluation and the control group that did not, while results from Experiment 2 show effects from the CS+ associated with the devalued outcome and the CS+ associated with the outcome that was still valued. Plots of Experiment 1 are based on 40 participants and error bars indicate the between subjects standard error of the mean; plots from Experiment 2 are based on 20 participants and error bars indicate the within subject standard errors of the mean.
